Learn how to analyze paid ad performance with our proven agency framework. Master cross-platform reporting, spot creative fatigue, and scale your operations.
It's the first week of the month, and the pressure of analyzing paid ad performance for 15 different clients is mounting. You're drowning in spreadsheets, trying to stitch together a coherent story from Meta, Google, and TikTok data. Sound familiar? For agencies, this chaos is a major roadblock to scalability.
We've all been there. A recent report found that 56% of marketers feel they lack sufficient time for proper analysis. For agencies, that pressure is multiplied by every single client on your roster.
So, let's get straight to it. Analyzing paid ad performance is all about having a system to track key metrics (like CTR, CPA, and ROAS), compare them against benchmarks, and turn that data into a story your clients can actually understand.
For agencies, the real magic is doing this efficiently, consistently, and at scale. It's the difference between being a spreadsheet jockey and a strategic partner. And let's be honest, we all want to be the latter.
This guide is your new playbook. We're handing you our complete, agency-focused framework to streamline your analysis, create impressive client reports in a fraction of the time, and make data-driven decisions that boost client results and retention.
Let's turn that reporting-week dread into your agency's biggest flex.
What You'll Learn
- How to structure your analysis by funnel stage for clear client communication
- Key performance benchmarks across Google, Meta, and TikTok
- A daily, weekly, and monthly workflow to manage multiple client accounts
- How to spot and solve creative fatigue before it hurts client ROAS
- Bonus: A downloadable client reporting checklist
Why a Standardized Analysis Framework is Your Agency's Superpower
Let's talk about your agency's secret weapon. It's not a fancy tool or a genius media buyer (though those help!). It's a standardized analysis framework.
Ever spent an hour trying to remember how you calculated blended ROAS for "Client A" so you can replicate it for "Client B"? That's a recipe for burnout, mistakes, and a whole lot of wasted time. A standardized framework isn't about being rigid; it's about being smart. It's the secret sauce that lets top agencies scale without the chaos.
Here's why this is a game-changer for your agency:
- **Scalability:**When you have a proven system, onboarding new clients and team members becomes a breeze. Instead of reinventing the wheel, you hand them a playbook that's already winning. This is how you go from 5 clients to 25 without pulling your hair out.
- **Efficiency:**We're talking about slashing your reporting time. A standardized process kills decision fatigue and lets you jump from data-pulling to finding those golden insights in record time. More time for strategy, less time for VLOOKUPs. Amen to that.
- **Client Retention:**Consistency builds trust. When clients get professional, data-backed insights month after month, they see your value. You're not just "running ads"; you're the strategic partner guiding their growth. This is how you turn a 3-month contract into a 3-year partnership.
Your job is to prove you're the one delivering that value. After all, paid search ads account for 27.6% of new visitor traffic for B2B companies, and businesses make an average of $2 in revenue for every $1 spent on Google Ads.
**Pro Tip:**Use this framework to create a master template in Google Slides or your reporting tool . When it's time to report, you just duplicate, update the data, and add your strategic commentary. This will save you hours every single month.
Analify AI — شاشة الـ media buyer مجاناً
بطّل تخمين أرقام الربح.
وصّل Shopify وMeta وTikTok وBosta في 5 دقايق.
ابدأ مجاناً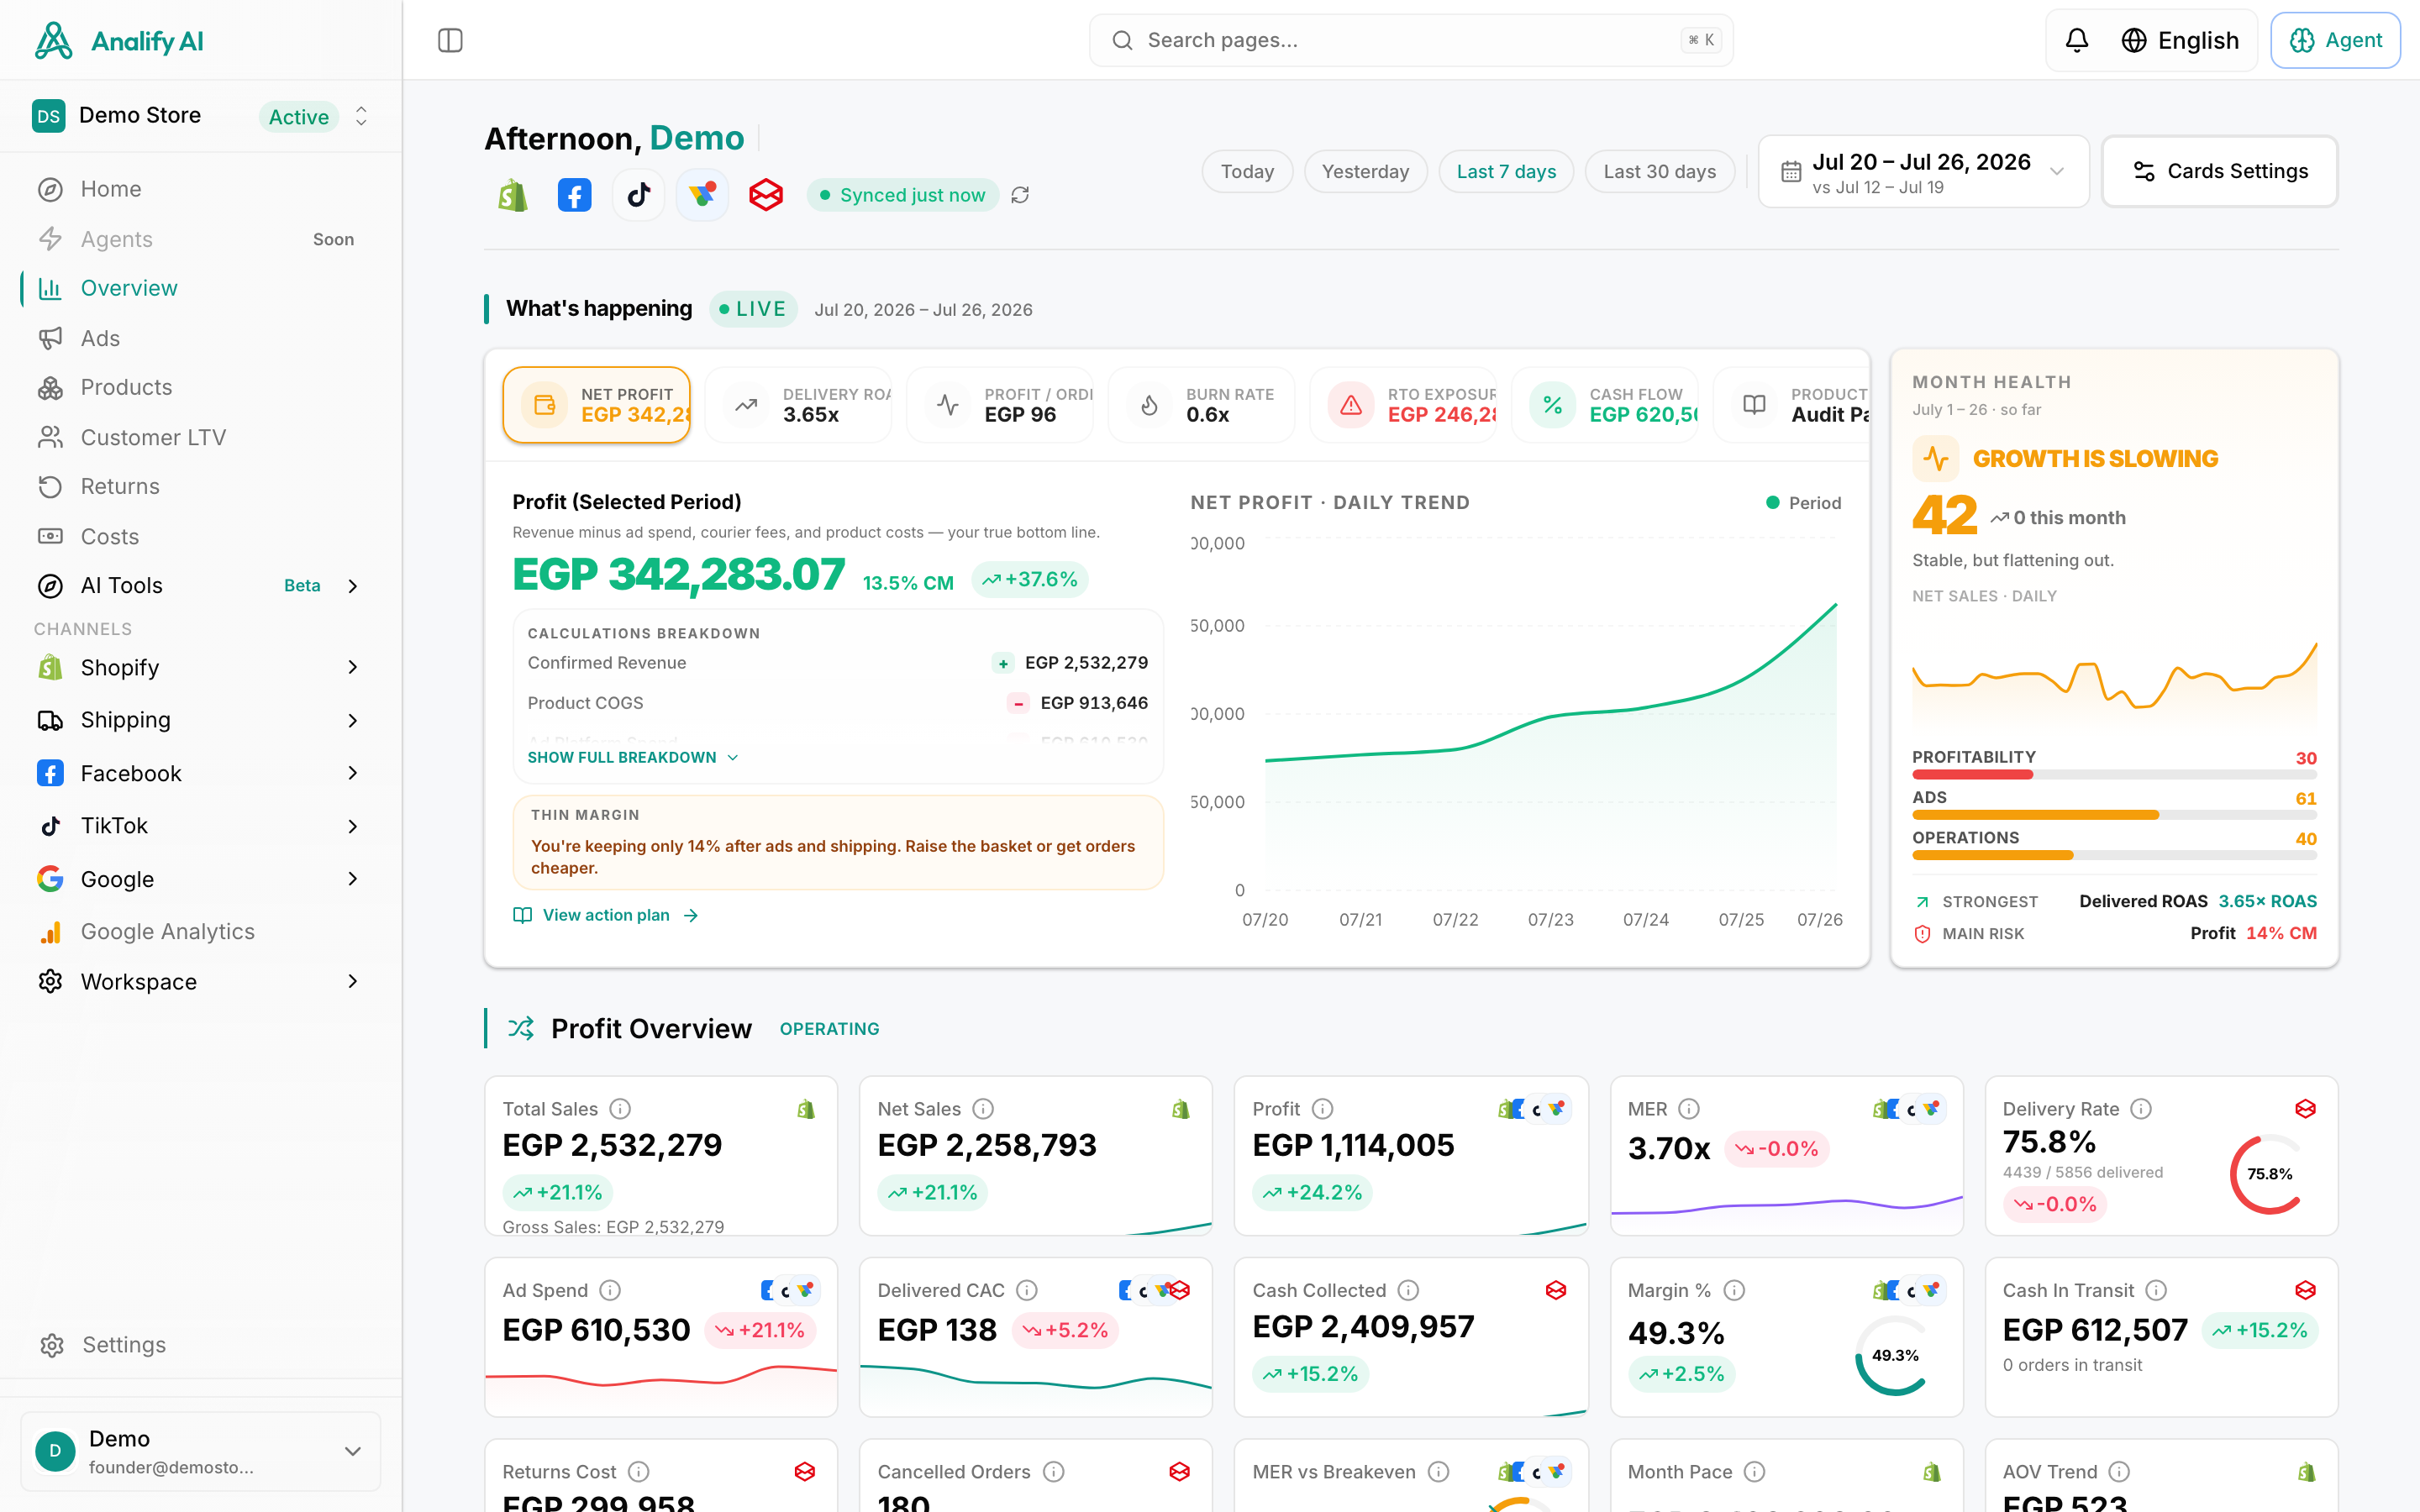
The Metrics That Matter: A Funnel-Based Approach for Client Reporting
Let's be real: clients don't care about a dozen different metrics. They care about results.
The best way to communicate performance is to tie your metrics to their business goals using the marketing funnel. This approach is a core part of effective marketing analytics, as it connects ad data directly to business outcomes. It tells a story they can actually follow and understand. Here's how we break it down.
Top of Funnel (TOFU): Awareness & Reach
This is all about getting eyeballs on the brand. We're introducing the client's business to cold audiences who've probably never heard of them.
**Impressions:**The number of times your ads were on screen.
- How to Explain It to Your Client:"This tells us how many times we put your brand in front of potential new customers. It's the first step to building brand recognition in our target market."
**Click-Through Rate (CTR):**The percentage of people who saw your ad and clicked it.
- How to Explain It to Your Client:"A high CTR shows we're reaching the right people with a message that grabs their attention. It validates our targeting and creative are on the right track."
Middle of Funnel (MOFU): Consideration & Engagement
Okay, they've clicked. Now what? We need to see if they're genuinely interested. This is where we separate the curious from the committed.
**Cost Per Click (CPC):**The average amount you pay for each click.
- How to Explain It to Your Client:"This is our cost to bring an interested person to your website. We watch this closely to make sure we're acquiring traffic as efficiently as possible."
**Conversion Rate (CVR):**The percentage of people who took a desired action (like adding to cart or signing up) after clicking.
- How to Explain It to Your Client:"This metric shows how effective your website and offer are at turning visitors into potential customers. It's a key indicator of landing page performance and tells us if we need to suggest any tweaks."
Bottom of Funnel (BOFU): Conversion & Profit
This is the money stage. 💰 We're targeting warm audiences and driving sales. These are the metrics your clients really care about.
**Cost Per Acquisition (CPA):**The average cost to acquire one paying customer.
- How to Explain It to Your Client:"This is your bottom-line cost to get a new customer. Our main job is to keep this well below your product margin so you're profitable on every sale."
**Return on Ad Spend (ROAS):**The total revenue generated for every dollar spent on ads.
- How to Explain It to Your Client:"This is our north star for profitability. A ROAS of 4x means for every $1 we spend on ads, you make $4 back. It's the clearest measure of our campaign's success." **Pro Tip:**When you report CPA to clients, always present it alongside ROAS. A "high" CPA might look scary on its own, but if it's for a high-ticket item with a 10x ROAS, it's a massive win. Context is everything.
To give that context, you need benchmarks. Here's a quick look at what to aim for across the major platforms.
Platform Performance Benchmarks
Metric Meta (Facebook/Instagram) Google Ads (Search) TikTok Ads
CTR 1.25% 3.17% N/A
CPC $2.85 $2.69 $1.80
CVR 1.62% 3.75% 2.14%
A quick heads-up: These are general benchmarks from industry reports. Your client's industry, offer, and audience will make these numbers swing. Use them as a starting point for analysis, not an absolute rule.
The Agency Analysis Workflow: Daily, Weekly, and Monthly Cadences
Great analysis isn't a one-time event; it's a rhythm. You can't just pop in on the last day of the month and hope for the best.
Here's the cadence top agencies use to stay ahead of performance for every single client—without living in Ads Manager 24/7.
Daily Checks (15 mins per client)
Think of this as your morning coffee check-in. It's not about deep strategy; it's about preventing disasters.
- **Spend Pacing:**Are we on track with the budget? Are any campaigns suddenly burning cash or not spending at all?
- **Critical Alerts:**Any disapproved ads? Account errors? Any wild performance swings (like CPA or ROAS jumping more than 20-30%)?
This daily check is where you can save a ton of time. Instead of logging into 15 different ad accounts, you can use the Analify Business Dashboard to get a 60-second overview of all client accounts at once. It flags major changes for you, so you know exactly where to put your attention.
Weekly Deep Dives (1 hour per client)
This is where the real optimization happens. Block this time on your calendar and protect it.
- **Creative Performance Review:**Which ads are getting tired? Which are the winners? Any new top performers we should double down on? (We'll dive deep into this in the next section).
- **Audience & Search Term Analysis:**In Meta, check for audience saturation. In Google, scrub the Search Terms Report for negative keywords and new opportunities.
- **Budget Allocation Shifts:**Based on the data, should you move the budget from underperforming campaigns to the winners? This is how you proactively juice the ROAS.
Monthly Strategic Reviews (2 hours per client)
Now you're the CFO. Zoom out, look at the big picture, and get ready for your client call.
- **Trend Analysis:**How did we do this month compared to last month (MoM) and the same month last year (YoY)? Find the trends and, more importantly, explain why they're happening.
- **Presenting the "Story":**Use that funnel-based structure to tell a clear story about how you moved customers from "who's that?" to "take my money!"
- **Strategic Planning:**Based on the results, what's the game plan for next month? Propose new campaigns, creative angles, or budget shifts to show you're always two steps ahead. This proactive approach is key to effective agency reporting. **Pro Tip:**Share this daily, weekly, and monthly cadence with your clients during onboarding. It sets clear expectations and shows them right away that you have a proactive, buttoned-up process for managing their account.
Analify AI — شاشة الـ media buyer مجاناً
بطّل تخمين أرقام الربح.
وصّل Shopify وMeta وTikTok وBosta في 5 دقايق.
ابدأ مجاناًThe Overlooked Goldmine: How to Analyze Creative Performance
Here's the thing: your targeting can be perfect and your bidding strategy flawless, but bad or tired creative will sink a campaign. Yet, so many agencies just let ads run until they completely flatline.
Let's talk about how to prove to clients when it's time for a refresh and stay ahead of the dreaded creative fatigue.
Signs of Creative Fatigue
Creative fatigue is a real, measurable thing. It's what happens when your audience has seen your ad so many times they just start scrolling right past it.
- **Frequency is rising while CTR is falling:**This is the classic sign. People are seeing it more but clicking it less. Some data suggests performance can dip once an ad's frequency goes above 3.
- **CPA is steadily climbing:**If your targeting and offer haven't changed, but your cost to get a customer is creeping up, your creative is the likely culprit.
- **An increase in negative comments:**Are people commenting "I see this ad every day!" or "Stop showing me this"? That's your audience literally telling you it's time for a change. Listen to them!
How to Track Creative Performance
You have to look at the ad level, not just the campaign or ad set level.
- **Use Asset-Level Reporting:**In Facebook Ads Manager, use the "Breakdown" menu to view performance by "Image," "Video," or "Headline." This shows you exactly which parts are doing the heavy lifting.
- **Create a "Creative Winners" & "Graveyard" Log:**For each client, keep a simple spreadsheet. When an ad crushes it, move it to the "Winners" tab. When it dies, move it to the "Graveyard." This helps you spot patterns in what works (and what doesn't).
We know this process can be a huge manual lift, but it doesn't have to be. Analify AI Chat can analyze your creative performance for you. Just ask, "Which of my ads are showing signs of fatigue?" and it will flag assets with declining engagement. Then, you can use the AI Ad Generator to quickly spin up new variations to test.
Solving Multi-Platform Chaos: A Unified Analysis Approach
Tired of having 10 tabs open just to answer one simple client question like, "What was our total spend and revenue last month?" Yeah, us too. Let's fix that.
Analyzing performance across Meta, Google, and TikTok is a massive headache. Each platform has its own attribution, metric names, and interface. The key to solving this is creating a single source of truth.
Cross-Platform Analysis Challenges & Solutions
Challenge The Hard Way (Manual Grind) The Smart Way (Automated Flow)
Different Naming Conventions Create a strict, agency-wide campaign naming convention and pray everyone follows it. Use a platform that automatically ingests and standardizes data from all your channels.
Varying Attribution Models Export everything into a spreadsheet and manually try to align the data using a single attribution model. Connect your accounts to a tool that offers blended metrics (like MER) right out of the box.
Data Silos Spend hours each month copying and pasting data from Meta, Google, TikTok, and Shopify into a master spreadsheet. Use a dashboard that automatically pulls all your data into one real-time view. ✨
Inaccurate Tracking (iOS) Rely on platform-reported data, make educated guesses, and try to explain the discrepancies to skeptical clients. Implement server-side tracking to improve data accuracy and get a much clearer picture of what's really working.
This is the exact problem Analify was built to solve. The platform automatically blends data from Meta, Google, TikTok, GA4, and Shopify into one unified view. Our built-in Server-Side Tracking helps you fight back against iOS tracking issues, sending more accurate conversion data back to Meta for better optimization and more reliable analysis.
The Top Paid Ad Analysis Tools for Agencies
Okay, let's talk tools. Choosing the right one can be the difference between scaling smoothly and hitting a wall. The best tools for agencies are built to function as a comprehensive agency analytics platform, designed for managing multiple clients, creating fast reports, and giving you cross-channel insights.
Here's our friendly breakdown of the leading contenders.