Master ad analysis with our proven 6-step framework. Learn to analyze ads across Meta, Google & TikTok to boost client results and prove your agency's value.
Picture this: it's Monday morning, and you're on a call with your highest-value client. They lean into the camera and ask the question that makes every agency owner's heart skip a beat: "So, are the ads actually working?"
You could throw out a few vanity metrics like, "Well, your CTR is up to 2%!" but you know that's not what they're really asking. They want to know if their investment is paying off, if their business is growing, and if you're the right team to make it happen.
Sound familiar? We get it. For agencies, proving your value is everything. This is where a solid ad analysis process becomes your secret weapon. It's the key to connecting the dots between ad spend and your client's bank account, so you can confidently say, "Here's what's working, here's what's not, and here's our plan to make it even better."
But doing this effectively for one client is tough enough. Doing it across dozens of clients on multiple platforms like Meta, Google, and TikTok? That's a recipe for spreadsheet-induced madness and 14-hour workdays.
What if you had a clear, repeatable framework that could turn any team member—from your newest junior account manager to your seasoned head of strategy—into an analysis pro? A system that saves you hours, impresses clients, and actually helps boost their results? Stick with us, because that's exactly what we're about to build together.
What You'll Learn
- How to build a unified analysis framework for Meta, Google, and TikTok
- The core metrics that actually matter for proving value to clients
- Actionable thresholds to know exactly when to scale, optimize, or pause
- How to analyze performance across multiple platforms for a holistic view
- A simple reporting process to communicate results effectively to clients
What is Ad Analysis? (And Why It's Your Agency's Superpower)
Ad analysis is the process of examining advertising data—like clicks, costs, and conversions—to understand campaign performance. It involves identifying what drives results, connecting ad spend to revenue, and using these insights to make data-driven decisions for future optimizations. For an agency, it's the engine that drives client retention, account growth, and your reputation. It's the difference between being a task-doer and a strategic partner.
When you master ad analysis, you stop just reporting numbers and start interpreting them to tell a story. A story of how your work is directly impacting your client's bottom line.
In a world where digital ad spend is projected to hit a staggering $740 billion in 2025, being able to navigate this landscape effectively isn't just a skill—it's a necessity. The ad analytics market itself is expected to grow to $20.33 billion by 2035, which tells you one thing: data is king.
Why does this matter so much for your agency?
- **It Helps Prove Your Value:**Solid analysis connects your ad management directly to client revenue, making your agency a more valuable partner.
- **It Boosts Client Retention:**When clients see you're making smart, data-backed decisions that grow their business, they stick around.
- **It Scales Accounts Profitably:**Analysis uncovers hidden opportunities to scale winning campaigns and cut budget waste, improving the potential for profitability for both you and your client.
Don't just take our word for it. According to Camphouse.io, data-driven companies are 23 times more likely to acquire customers than their peers.
By embedding a strong analysis framework into your agency's DNA, you're not just managing ads; you're building a data-driven growth machine for your clients.
Analify AI — free media buyer view
Stop guessing your profit.
Connect Shopify, Meta, TikTok and Bosta in 5 minutes.
Start free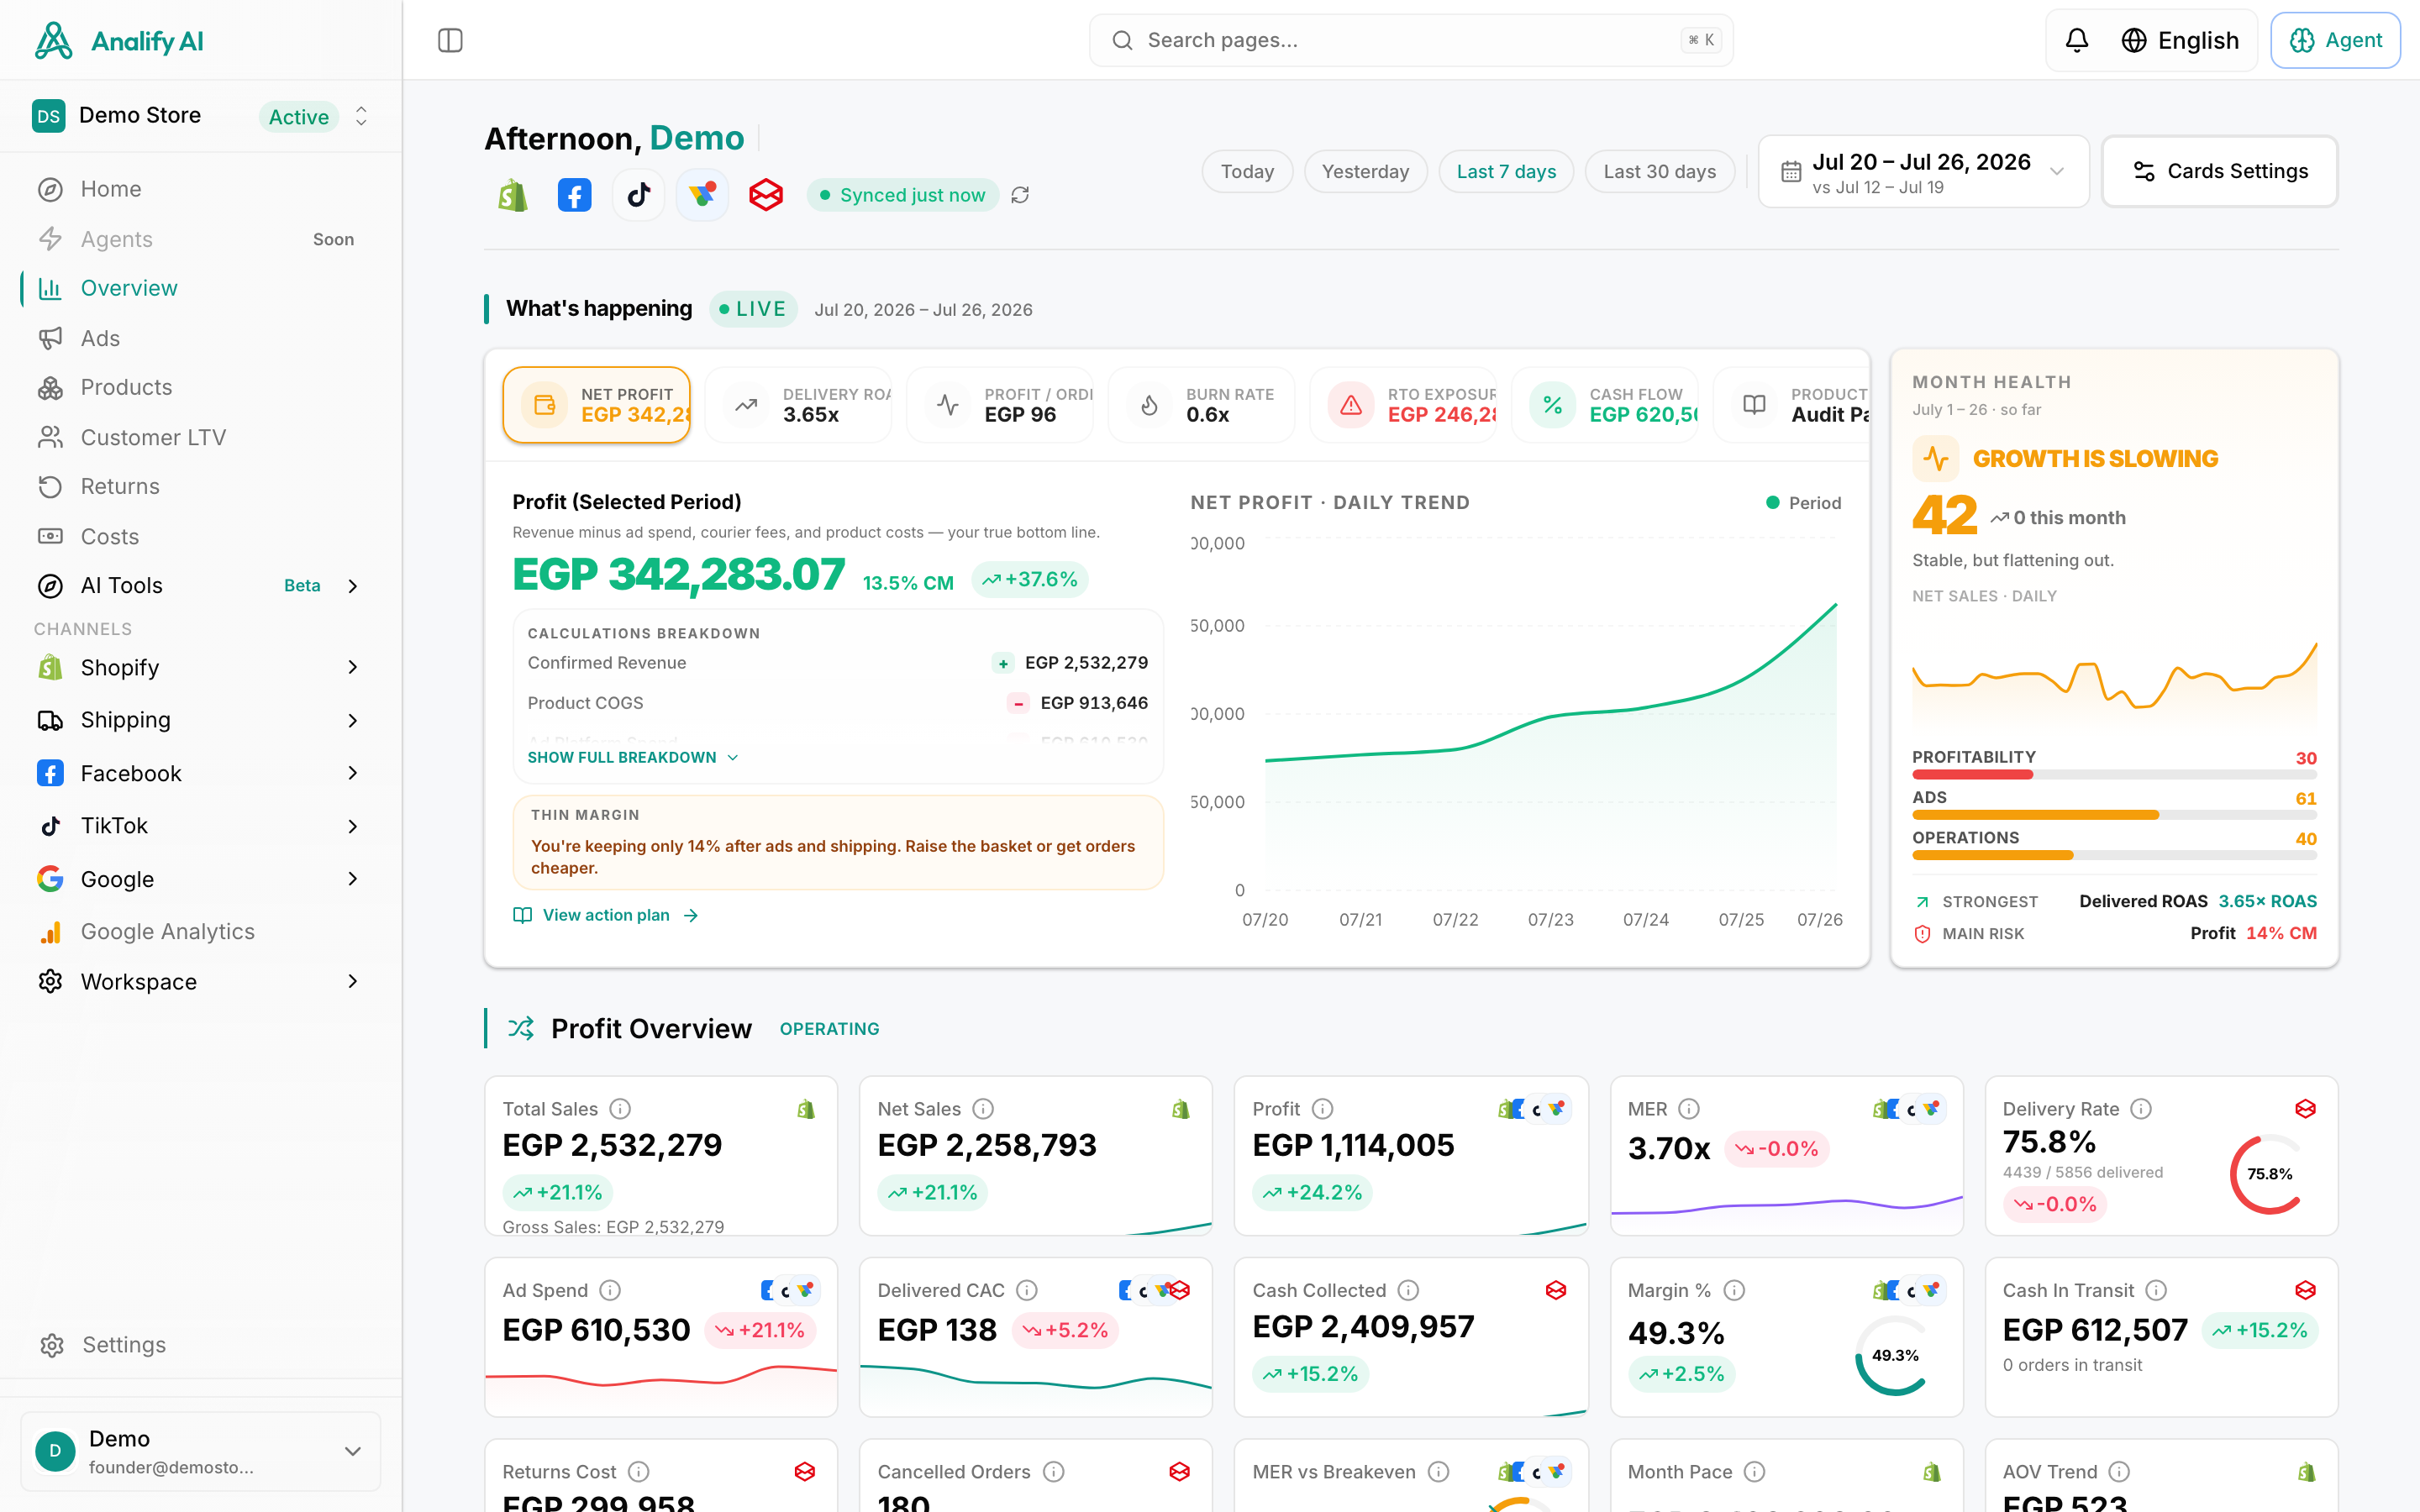
The Core Ad Performance Metrics That Actually Matter for Clients
Ever presented a report full of acronyms only to be met with a blank stare? Yeah, us too. Clients don't care about every single metric under the sun. They care about the ones that translate to business results.
To make this simple, we can group the most important metrics into three categories: Performance, Delivery, and Engagement.
Let's break down the heavy hitters your clients actually want to hear about.
Performance Metrics (The "Money" Metrics)
These are the bottom-line numbers that show if the ads are making money.
- **Return on Ad Spend (ROAS):**The holy grail. If your client only looks at one number, this is it. This tells you how much revenue you're generating for every dollar spent on ads.
- Formula: (Total Revenue from Ads / Total Ad Spend)
- Why it Matters: It's the clearest indicator of profitability. A high ROAS is a strong indicator of a highly profitable campaign.
- **Action Threshold:**For an e-commerce client, if ROAS is consistently below a 2.5:1, it's time to investigate. While a median profit ROI for successful campaigns is 2.5:1, this can vary.
- **Cost Per Acquisition (CPA) / Cost Per Result:**This is what it costs to get one desired action (a purchase, a lead, a sign-up).
- Formula: (Total Ad Spend / Total Conversions)
- Why it Matters: It helps you understand the efficiency of your campaigns. A low CPA means you're acquiring customers cheaply.
- Action Threshold: If CPA is higher than the client's Average Order Value (AOV) or Customer Lifetime Value (CLV), you're losing money on every conversion. Time to optimize!
- **Conversion Rate (CVR):**The percentage of people who clicked your ad and then completed the desired action.
- Formula: (Total Conversions / Total Clicks) x 100
- **Why it Matters:**A high CVR indicates your ad and landing page are perfectly aligned and persuasive. A low CVR is a huge red flag that there's a disconnect between your ad's promise and the landing page experience.
Delivery & Engagement Metrics (The "Diagnostic" Metrics)
These metrics help you understand why your performance metrics are what they are. They are the clues to your optimization puzzle.
- **Click-Through Rate (CTR):**The percentage of people who saw your ad and clicked on it.
- Formula: (Total Clicks / Total Impressions) x 100
- Why it Matters: It's a primary indicator of creative and audience relevance. A high CTR means your ad is grabbing attention and resonating with your target audience.
- Benchmark: This varies wildly by platform. Theaverage CTR for Google Search ads is around 6.66%, while the median CTR for Facebook ads is much lower at 1.78%. Context is key!
- **Cost Per Click (CPC):**The average amount you pay for each click on your ad.
- Formula: (Total Ad Spend / Total Clicks)
- Why it Matters: It directly impacts your CPA. If your CPCs are skyrocketing, your CPA will likely follow unless your conversion rate is amazing.
- Action Threshold: If your CPC suddenly doubles overnight, check for increased competition in the auction or potential ad fatigue. **Pro Tip:**Feeling overwhelmed trying to track all this for every client? Instead of digging through Ads Manager, use a tool like Analify AI Chat and simply ask, "What's the ROAS for Client X's prospecting campaign this week?" You get an instant, data-backed answer, saving you precious time.
The 6-Step Ad Analysis Framework for Agencies
Alright, let's get to the good stuff. Here is a simple, repeatable 6-step framework you can use for every client, every time. It's designed to be so straightforward that you can hand it to a new hire and help them conduct effective analysis quickly.
Step 1: Set the Objective
Before you dive into a single spreadsheet, stop and ask: What are we actually trying to do here? Is the client focused on generating leads? Driving e-commerce sales? Increasing brand awareness? The primary goal dictates which metrics matter most. For an e-commerce advertising strategy, ROAS is king. For lead gen, it's all about CPL (Cost Per Lead).
Step 2: Collect the Data
This is often the most time-consuming step for agencies. You need to pull performance data from Facebook Ads Manager, Google Ads, and TikTok Ads, then cross-reference it with Shopify for revenue and Google Analytics 4 for on-site behavior. Doing this manually is a soul-crushing copy-paste marathon.
Step 3: Analyze Key Metrics vs. Benchmarks
Take the data you've collected and compare it against your targets and industry benchmarks. Is your client's 2:1 ROAS good or bad? It depends! For a high-margin luxury brand, it might be fantastic. For a low-margin dropshipping store, it's a disaster. Context is everything.
Step 4: Segment, Segment, Segment!
This is where you go from being a good agency to a great one. Never look at your data as just one big number. You have to slice and dice it to find the gold. Analyze performance by:
- Platform: How is Facebook performing vs. Google?
- Campaign: Is your prospecting campaign hitting its CPA target?
- Audience: Are your lookalike audiences outperforming your interest-based ones?
- Creative: Which ad image or headline is driving the lowest CPC?
- Demographics: Are men aged 25-34 converting better than women in the same age group?
Segmentation turns broad, confusing data into specific, actionable insights.
Step 5: Identify Insights & Formulate a Hypothesis
Based on your segmented analysis, what did you learn? Don't just state the facts ("Ad A has a higher CTR than Ad B"). Dig deeper for the why.
- Insight:"Our video ads featuring user-generated content have a 50% lower CPA than our polished studio ads."
- Hypothesis:"Our target audience responds better to authentic, relatable content. We should allocate more budget to UGC-style creative."
Step 6: Report Findings & Take Action
Now, package your insights into a clear, concise report for the client. Most importantly, act on what you've learned. Based on your hypothesis, launch new tests, reallocate budgets, or pause underperforming assets. This closes the loop and starts the cycle all over again, creating continuous improvement.
To keep your agency on track, use an Analysis Frequency Matrix:
Frequency
Time Allotment
Key Tasks
Daily
15 mins
Check spend, pacing, and major red flags (e.g., sudden CPA spikes).
Weekly
1–2 hours
Deep dive into campaign, ad set, and ad performance. Make optimization decisions (scale, pause, test).
Monthly
2–4 hours
Conduct strategic review of overall account, cross-channel performance, and prepare client reports.
The Unified View: Analyzing Performance Across Multiple Platforms
Here's where most agencies get stuck. It's one thing to analyze Facebook ads in a vacuum. It's another to create a cohesive story that includes Google, TikTok, and your client's own website data.
How do you explain to a client that a $50 CPA on Google Search is great, but a $50 CPA on Facebook prospecting is terrible? How do you calculate a true, blended ROAS when a customer saw a TikTok ad, clicked a Google ad, and then bought after seeing a Facebook retargeting ad?
This is the challenge of cross-channel attribution, and solving it is what separates good agencies from great ones. You need to educate your clients on the concept of a marketing ecosystem, where different channels play different roles:
- **TikTok/Facebook Prospecting:**Think of this as the party starter. Its job is to introduce the brand to new people and create demand. We're looking for good CTRs and low CPCs here.
- **Google Search:**This is the problem-solver. People are actively searching for a solution, and your ad is there to provide it. CVR and CPA are everything here.
- **Facebook/Instagram Retargeting:**This is the closer. It brings back people who've already shown interest and convinces them to finish the purchase. ROAS is the only thing that matters.
Trying to blend this data manually in a spreadsheet is not only a nightmare, but it's also prone to errors. This is where a tool like Analify becomes a powerful asset for a modern agency.