Stop wasting hours on manual reports. Learn how to build a powerful advertising dashboard that unifies data, proves ROI, and helps your agency scale.
Tired of the "10 tabs open" nightmare every time a client asks for a performance update? Drowning in a sea of spreadsheets, trying to manually stitch together data from Meta, Google, and TikTok, only for the numbers to never quite match up?
We've all been there. And you're not alone. We get it. Many agencies hit a scaling wall, not because of a lack of clients, but because their reporting process is fundamentally broken. It's a time-consuming, error-prone cycle that keeps your best people bogged down in data entry instead of strategy.
And let's be honest, the data chaos is real. Research shows that, according to a Gartner survey, 76% of marketing leaders feel overwhelmed by the volume of data they receive. You have the data, but turning it into clear, actionable insights feels like a full-time job in itself.
This article is your way out of that cycle. We're going to show you how to build a streamlined, actionable advertising dashboard that not only saves you dozens of hours a week but also provides the crystal-clear insights your clients love.
What You'll Learn
- Why a centralized dashboard is the key to agency scaling
- The exact KPIs to include for clear, client-friendly reporting
- A 5-step process to build an actionable dashboard from scratch
- How to solve the #1 agency headache: attribution mismatches
- A "Build vs. Buy" framework to choose the right tech stack
What is an Advertising Dashboard? (And Why Your Agency Desperately Needs One)
Let's start with a simple, direct definition. An advertising dashboard is a visual interface that pulls all your key performance indicators (KPIs) from various ad platforms into a single, unified view. For agencies, it's the mission-control center for monitoring all client accounts, campaigns, and channels at a glance.
But it’s so much more than a pretty chart. It’s your agency’s centralized source of truth.
Instead of jumping between Facebook Ads Manager, Google Ads, and your client’s Shopify store, you get a holistic view of performance in one place. This isn't just about convenience; it's about survival and growth. In a world where you're constantly battling for client attention and budget, a dashboard transforms your agency from a service provider into a strategic partner.
It lets you answer the most important client questions in seconds:
- "How are my ads performing today?"
- "What's our overall return on ad spend across all platforms?"
- "Which channel is driving the most profitable customers?"
Without a centralized dashboard, answering these questions means hours of manual work, exporting CSVs, and wrestling with VLOOKUPs. With one, it’s a matter of seconds. ✨
Pro Tip: A great agency dashboard tells a story: where the budget went, what the return was, and what we should do next. It’s not just data; it’s a narrative that proves your value.
The Business Case: How Dashboards Drive Agency Profitability
Alright, let's talk money. Investing time or resources into a proper dashboard system isn't a cost; it's a direct path to higher profitability. Here’s exactly how.
Benefit 1: Reclaim Your Team's Billable Hours
Think about the time your team spends every week and month just pulling reports. Now, what if you could slash that time and give it back to them? That’s what a dashboard does. It automates the tedious data collection, freeing up your account managers to focus on what you actually bill for: strategy, optimization, and scaling client accounts.
The impact is huge. According to industry analysis, businesses using centralized, real-time dashboards achieve 25% faster campaign decision-making and a 33% higher marketing ROI. Faster decisions mean less wasted ad spend and more time spent on revenue-generating activities.
Benefit 2: Scale Your Client Load, Not Your Headcount
Hiring is expensive and time-consuming. A well-built dashboard is a force multiplier for your team. It empowers even junior account managers to spot trends, identify underperforming ads, and make smart optimizations that would typically require senior-level oversight.
By standardizing your agency's "view" of success, you create a system where everyone can monitor account health effectively. This allows your senior strategists to focus on high-level client relationships and new business. You can take on more clients without your operational costs spiraling out of control.
Benefit 3: Drastically Improve Client Retention
Here's a hard truth: clients don't churn because of one bad campaign; they churn because of a lack of communication and perceived value. A transparent, easy-to-understand digital marketing dashboard is one of your most powerful retention tools.
When you can share a live link that clearly shows Spend, Revenue, and ROAS, you build immense trust. You’re not hiding behind confusing metrics; you’re giving them a clear window into their investment's performance. This transparency turns reporting sessions from defensive justifications into collaborative strategy meetings, solidifying your role as an indispensable partner.
Analify AI — free media buyer view
Stop guessing your profit.
Connect Shopify, Meta, TikTok and Bosta in 5 minutes.
Start free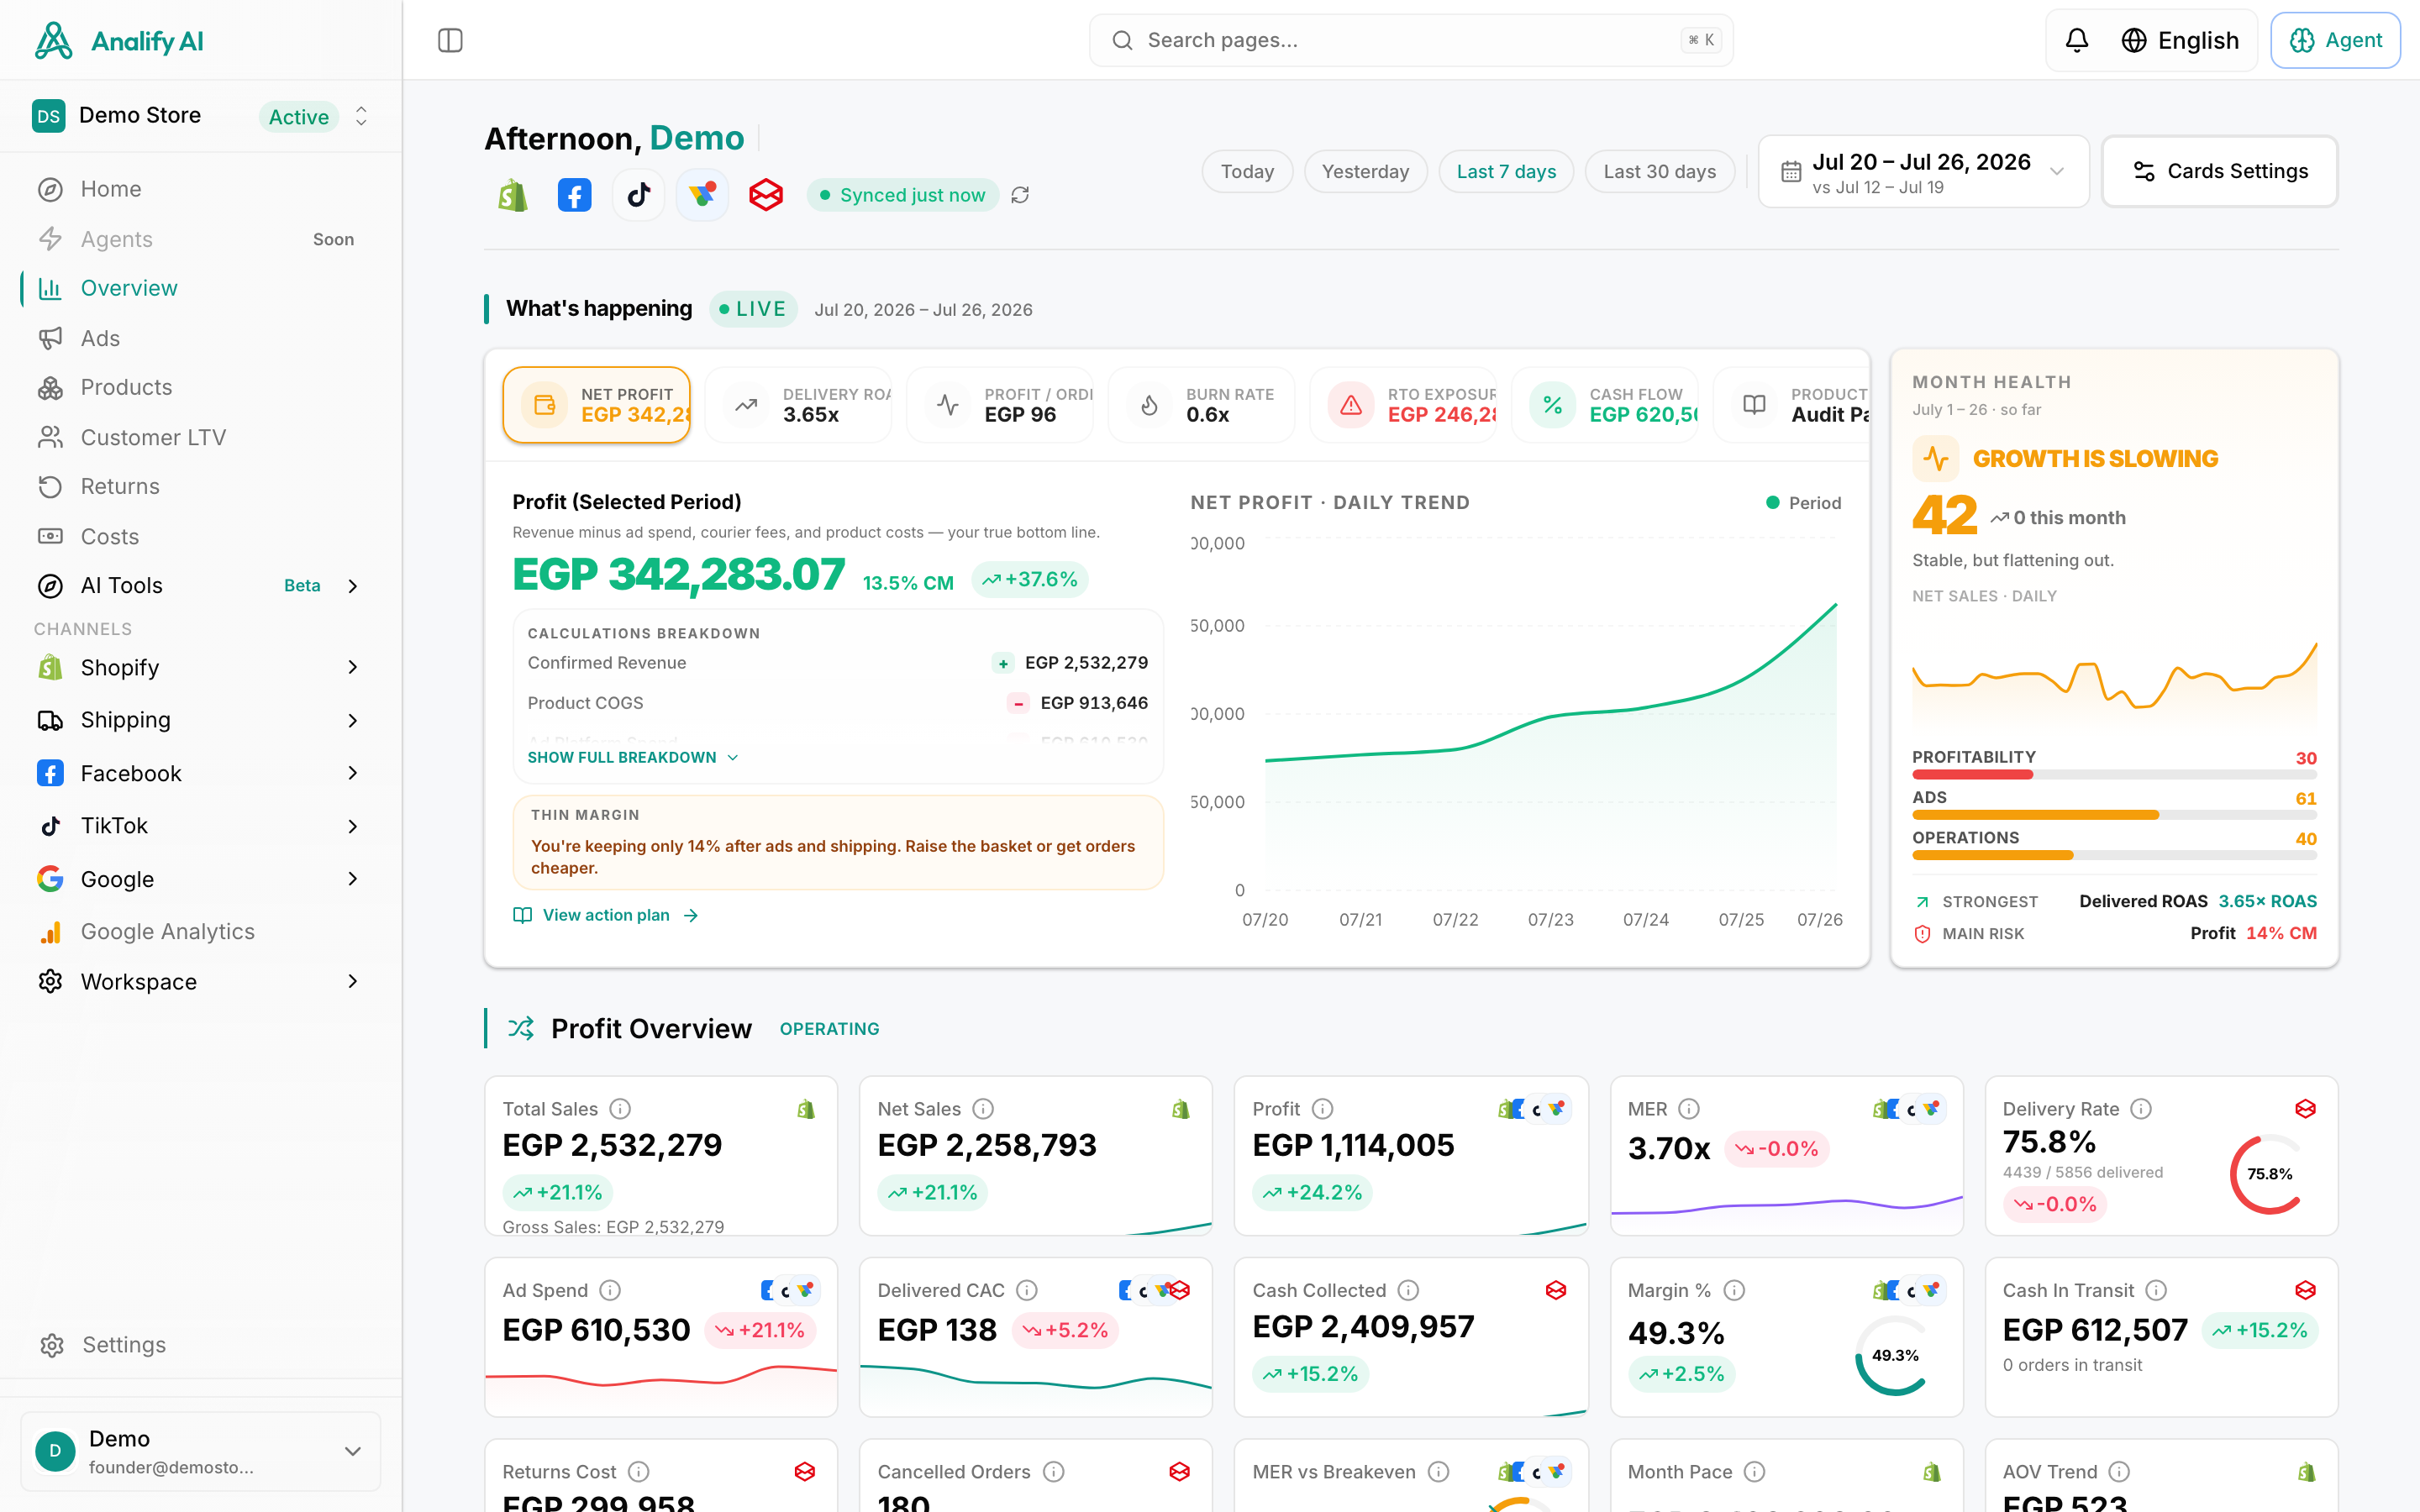
The Core KPIs for an Agency Advertising Dashboard
Not all metrics are created equal. A cluttered dashboard is just as useless as a spreadsheet. A great dashboard organizes KPIs into layers, so you can show the right information to the right person at the right time.
Here’s the simple framework we use to keep things clean and actionable.
Tier 1: The Executive Summary (For Your Client)
This is the top-line view for your clients. It should be dead simple, clean, and focused on business outcomes. No jargon, just results.
- Spend: How much money went out the door.
- Revenue: How much money came back in.
- ROAS (Return on Ad Spend): The most important top-level metric. For every dollar we spent, how many did we generate?
- CPA (Cost Per Acquisition): How much it costs to get one new customer.
- New Customers: The total number of new customers acquired.
Tier 2: The Diagnostic View (For Your Internal Team)
This is for your account managers. These metrics help them understand the why behind the Tier 1 results and diagnose performance issues before they become problems.
- CTR (Click-Through Rate): Are the ads compelling enough to earn a click?
- CPC (Cost Per Click): How much are we paying for traffic? Is it trending up or down?
- CVR (Conversion Rate): Of the people who click, what percentage are actually converting?
- Frequency: How many times is the average person seeing our ads? (Are we annoying them yet?)
- Blended ROAS/MER (Marketing Efficiency Ratio): Total revenue divided by total ad spend across all platforms. This is your true north for profitability.
Tier 3: Platform-Specific Metrics (For the Specialists)
These are the granular metrics your team uses for in-the-weeds optimizations. They usually don't belong on a client-facing dashboard but are crucial for your internal team's day-to-day work.
- Google Ads Quality Score: A measure of ad and landing page relevance.
- Meta Ads Outbound CTR: Differentiates between clicks to your website vs. clicks on the ad itself.
- TikTok 6s View Rate: A key indicator of creative effectiveness on the platform.
How to Build an Actionable Advertising Dashboard in 5 Steps
Ready to build? Here’s a repeatable process your agency can use to get it right every single time.
Step 1: Define Goals & KPIs (With Your Client)
First things first. Stop and ask the most important question: "What does success actually look like for this client?" Is it maximizing ROAS for an e-commerce store? Driving down cost per lead for a B2B service? Or acquiring new customers at a specific blended CPA?
The client's business objectives must define the dashboard's primary KPIs. Don't just copy and paste metrics from another account. Tailor the dashboard to tell the story that matters most to that client.
Step 2: Connect Your Data Sources
This is where the magic—and the potential for headaches—begins. You need to pull data from all the relevant platforms into one place. This typically includes:
- Ad Platforms: Meta (Facebook & Instagram), Google Ads, TikTok Ads
- Analytics Platform: Google Analytics 4 (GA4)
- E-commerce Platform: Shopify
- Email Platform: Klaviyo
Connecting these sources is what allows you to create that holistic view, blending ad performance with actual business results.
Step 3: Design a Decision-Oriented Layout
Don't just throw charts on a page and call it a day. Design with a purpose. A proven layout for agencies is:
- Top Row (The "At-a-Glance" Bar): Place your Tier 1 KPIs here (Spend, Revenue, ROAS, CPA). Use big, bold numbers so a client can understand account health in 5 seconds flat.
- Mid-Row (The "Channel Breakdown"): Use bar or pie charts to show the performance breakdown by channel (e.g., ROAS from Meta vs. Google vs. TikTok). This answers, "Where are our results coming from?"
- Bottom-Row (The "Deep Dive" Tables): Include tables with campaign-level or ad-set-level data. This is for your internal team to spot optimization opportunities without cluttering the client's view.
Step 4: Validate and Normalize Your Data
Remember: garbage in, garbage out. For your dashboard to be trustworthy, your data needs to be clean. This means establishing agency-wide best practices for:
- UTM Tagging: Use consistent UTM parameters on all your ads so you can track performance accurately in GA4. No exceptions!
- Campaign Naming Conventions: A structured naming system (e.g.,
Client_Channel_CampaignObjective_Date) makes it infinitely easier to filter and analyze data later. - Currency & Timezone Alignment: Ensure all data sources are set to the same currency and timezone to avoid those confusing (and embarrassing) discrepancies.
Step 5: Automate Data Refresh & Streamline Sharing
The final step is to get yourself out of the manual work. A truly efficient system has data that refreshes automatically. You can then share a live dashboard link with your client for real-time updates or schedule a PDF to be sent for your weekly reports. This is how you achieve true reporting nirvana. 🚀
The Agency Tech Stack: Build vs. Buy
Okay, so how do you actually make this happen? Agencies generally face two choices: build it yourself or buy a ready-made solution.
Approach The “Build” (DIY) Approach The “Buy” (All-in-One) Approach
Tools
Supermetrics / Porter Metrics
- Looker Studio / Power BI
Analify, AgencyAnalytics,
Whatagraph
Pros
✅ Ultimate customization and flexibility.
✅ Incredibly fast setup (minutes, not weeks).
Cons
❌ Time-intensive; requires technical expertise.
❌ Less customization than a full BI tool setup.
Best For
Agencies with dedicated data analysts.
Agencies focused on speed, efficiency, and scalability.
Pro Tip: If your agency has a dedicated data analyst on staff, the "Build" approach offers maximum flexibility. For most agencies focused on speed and efficiency, the "Buy" approach is the smart shortcut—it provides 90% of the value for 10% of the effort.