Open Meta Ads Manager. Look at the ROAS column. It says 3.2x. You feel good. You ask the agency to push spend by twenty thousand pounds tomorrow.
Three weeks later, the bank account is lower than it was. The campaign that "worked" — the one Meta said was a 3.2x — was actually a 1.4x once you account for the orders that came back. You scaled a leak.
This is the most common mistake in Egyptian DTC. Not because founders are bad with numbers. Because the platforms hand them a number that doesn’t exist in a COD market.
What Meta’s ROAS actually measures
Meta’s ROAS = Purchase Conversion Value / Ad Spend.
The "Purchase Conversion Value" is whatever the Pixel fires at — usually the order total at checkout. The order total at checkout in Egypt is the gross sale. It includes orders the buyer never collected. It includes orders the buyer cancelled at the door. It includes orders that came back to your warehouse two weeks later as inventory.
Meta’s ROAS is a prepaid-economy ROAS. In a credit card market, the order at checkout is the order in the bank. In Egypt, the order at checkout is a promise. About 75% of those promises are kept. The rest are not.
That means your real ROAS is roughly 70–80% of what Meta says it is. Sometimes less.
The right number: ROAS after RTO
ROAS after RTO = (Gross Sales × (1 − RTO%)) / Ad Spend
Or more precisely, using delivered revenue:
ROAS after RTO = Delivered Revenue / Ad Spend
That’s it. That’s the formula. The platforms don’t show it because they don’t know your RTO. You have to bring the RTO number to the math yourself.
Analify AI — free Meta profit view
Stop guessing your profit.
Connect Shopify, Meta, TikTok and Bosta in 5 minutes.
Start free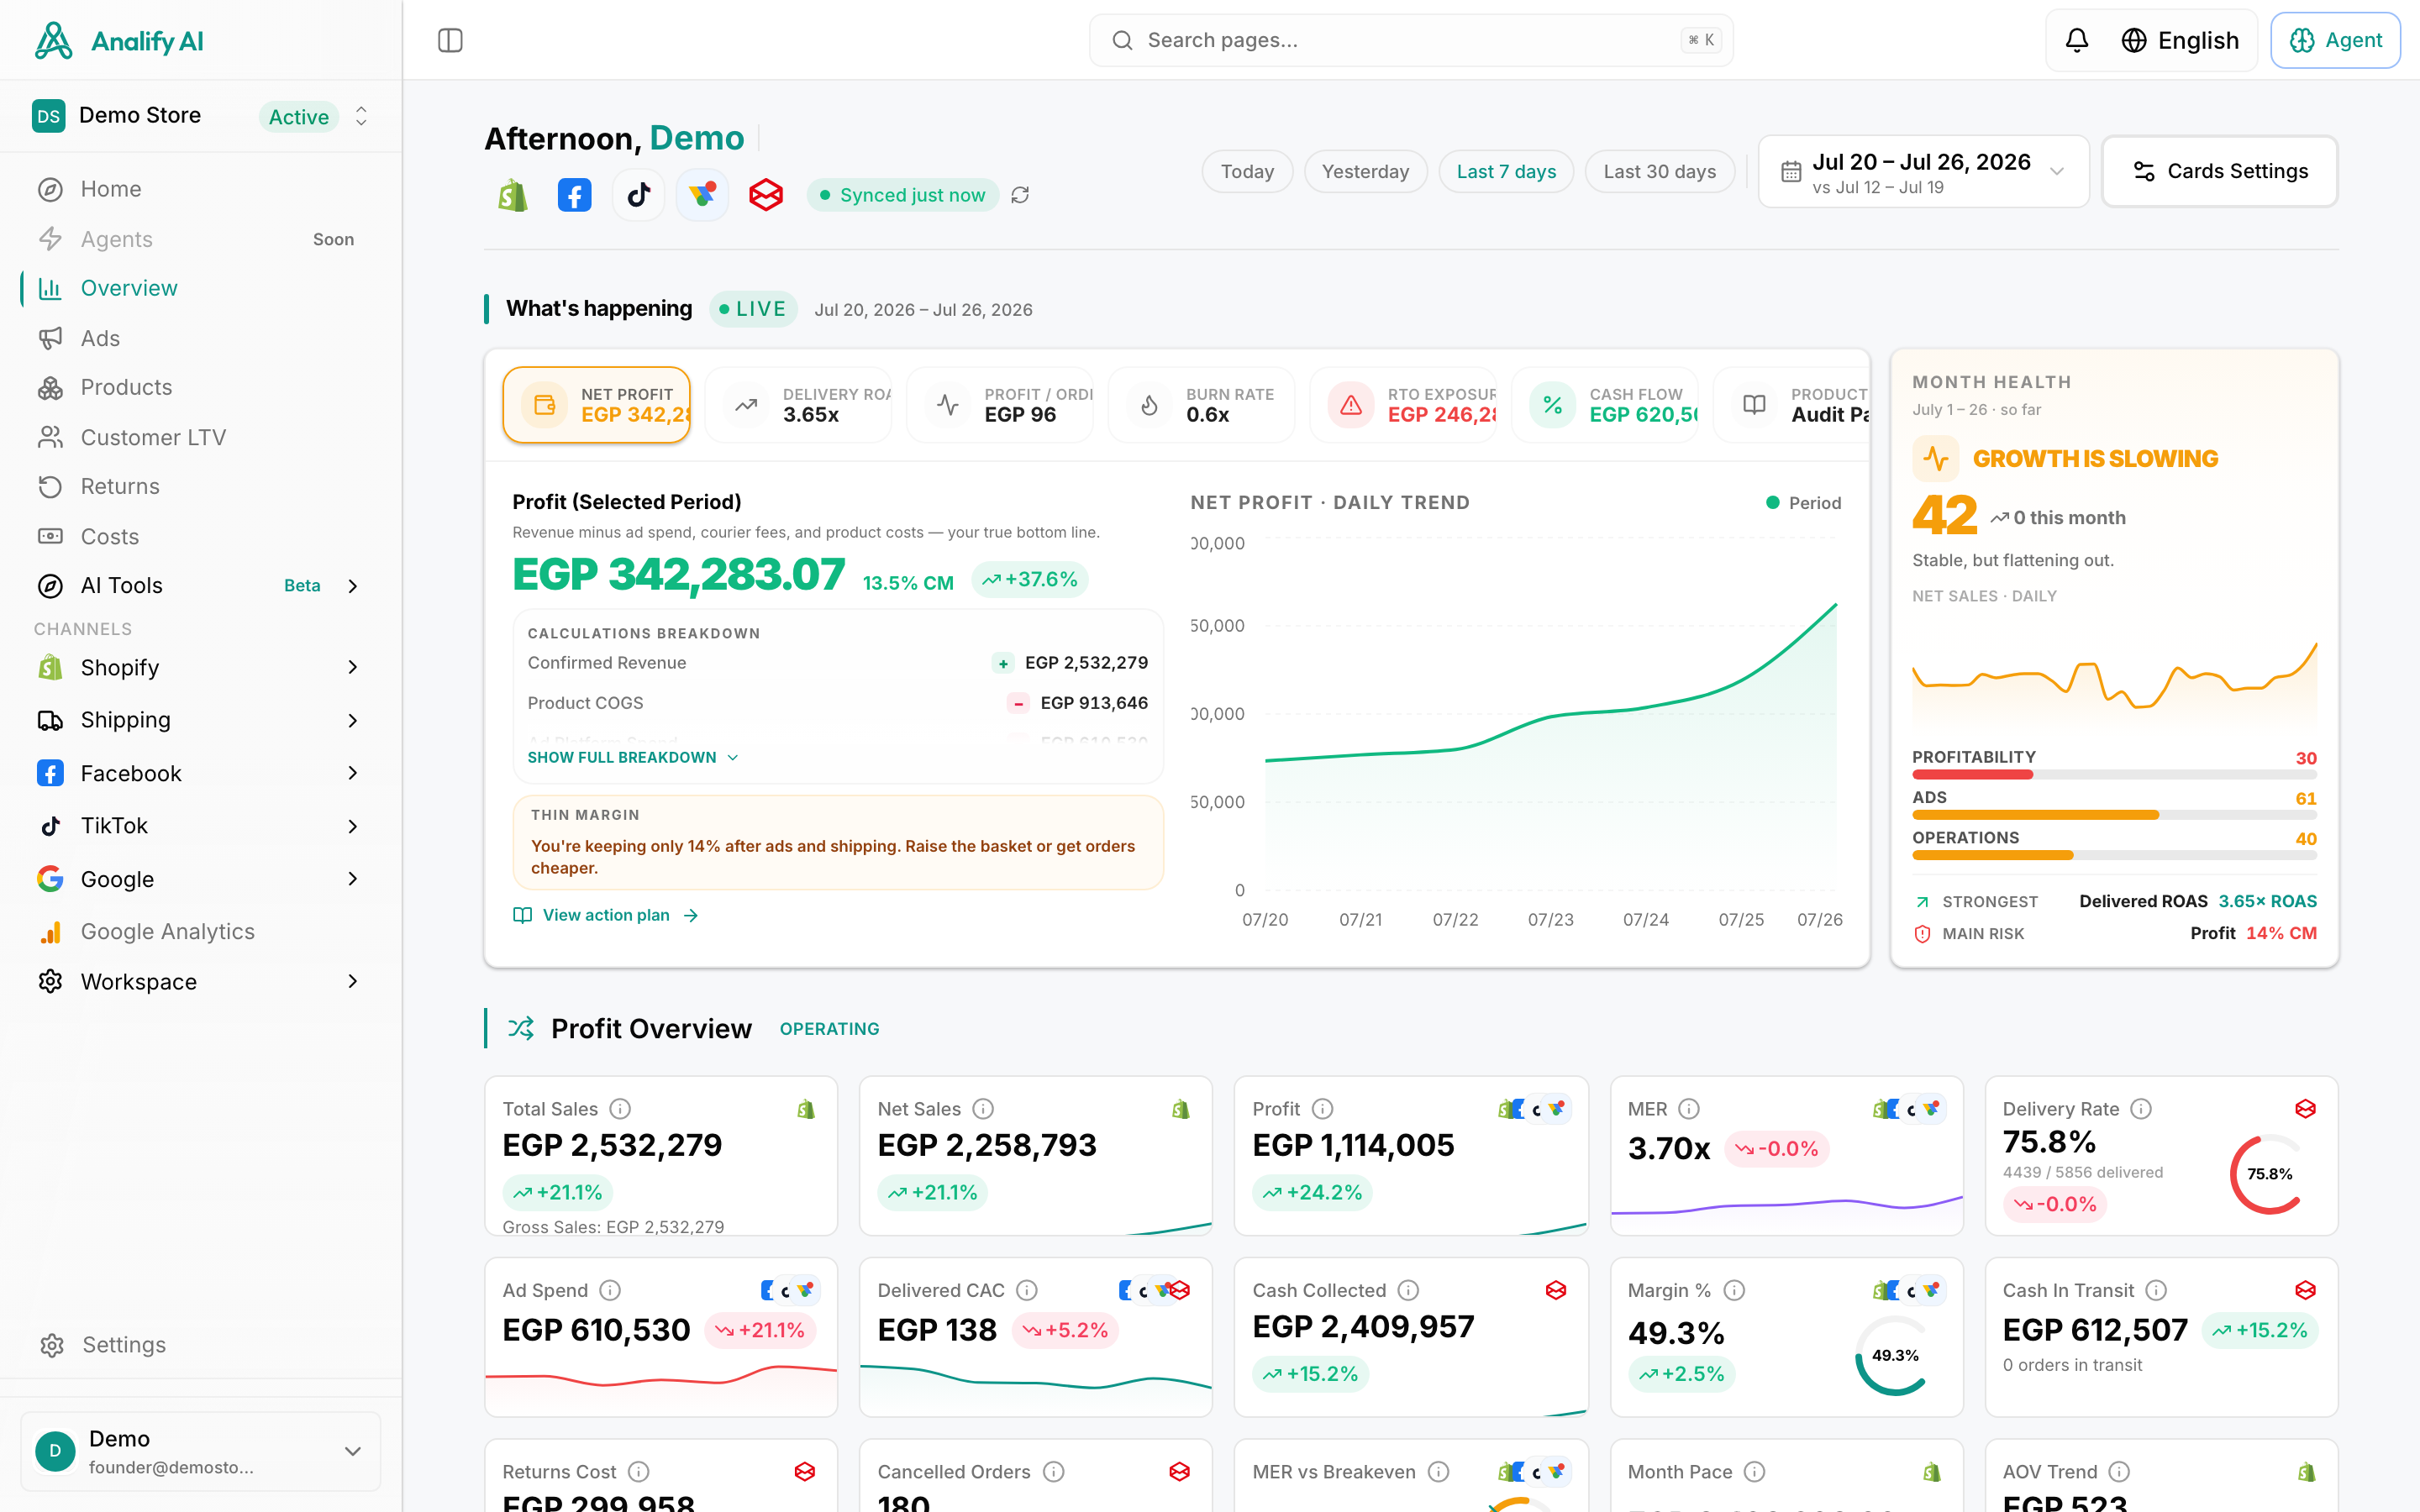
A real example
This is a real Egyptian fashion brand we worked with during pilot.
- Ad spend last month: EGP 42,000
- Meta-reported Purchase Value: EGP 138,000
- Meta-reported ROAS: 3.29x
- Real RTO: 27%
Delivered revenue = 138,000 × (1 − 0.27) = EGP 100,740
ROAS after RTO = 100,740 / 42,000 = 2.40x
That’s the real number. Still positive. Still scalable. But it is not a 3.29x business. A 3.29x business has different scaling math, different break-even, different patience for fatigue. A 2.40x business has a much narrower window.
If this founder scaled aggressively on the 3.29x reading, they’d hit walls fast. If they scaled patiently on the 2.40x reading, they’d have a real business.
ROAS after RTO by campaign, not just account
Account-level ROAS after RTO is a starting point. The real edge is campaign-level. Different campaigns drive different RTO. We see this constantly:
- Broad prospecting campaigns: higher RTO, because the audience is colder, more impulse, more buyers who change their mind at the door
- Retargeting campaigns: lower RTO, because the buyer saw the product multiple times before clicking
- Lookalike campaigns: middle of the road
- Influencer / UGC creative pushes: highest RTO of all, because the buyer clicked on emotion, not need
We’ve seen brands where the broad campaign reported 4.1x ROAS in Meta and turned into a 1.9x ROAS after RTO. We’ve seen retargeting campaigns reported as 2.6x in Meta turn into 2.5x after RTO. The retargeting campaign is the better business — even though Meta tells you the opposite.
ROAS after RTO by district
This is where it gets serious. If your broad campaign is hitting buyers across Cairo, Giza, and the governorates evenly, and Cairo RTO is 18% but governorate RTO is 38%, then your blended ROAS hides a brutal split. The Cairo half of that campaign is a 3.5x. The governorate half is a 1.1x. You’re paying to lose money in half your delivery zones.
You can’t fix this in Meta’s dashboard. You can only fix it by splitting your campaigns by delivery zone, or by capping COD in the bleeding districts.
Analify AI — free Meta profit view
Stop guessing your profit.
Connect Shopify, Meta, TikTok and Bosta in 5 minutes.
Start freeThe scaling thresholds we use
These are starting points. Tune to your AOV and COGS structure.
| Status | ROAS after RTO | Action |
|---|---|---|
| Bleeding | < 1.5x | Turn it off. You’re paying to lose. |
| Surviving | 1.5x – 2.0x | Hold, fix the leak (RTO, creative fatigue, audience overlap). |
| Healthy | 2.0x – 2.8x | Hold or slowly add 10–20% more budget per week. |
| Winning | > 2.8x | Add budget. Watch closely for fatigue. Build more creatives. |
These break-evens shift with your gross margin. If your COGS is 25%, you can survive at a lower ROAS after RTO. If your COGS is 45%, you need a higher one to clear profit.
The break-even math
Break-even ROAS after RTO is the point where Delivered Revenue − Ad Spend − COGS − Shipping = 0.
Rough rule of thumb for Egyptian fashion DTC:
Break-even ROAS after RTO ≈ 1 / (1 − COGS% − Shipping%)
For a typical brand at 35% COGS and 10% shipping cost on delivered revenue:
1 / (1 − 0.35 − 0.10) = 1 / 0.55 ≈ 1.82x
Below 1.82x ROAS after RTO, you’re losing money. The "ROAS 2.5x" you see in Meta could be a 1.7x after RTO — below break-even. Scaling that is how brands die.
How to put this into practice this week
- Pull your real RTO from your courier dashboard. Last 30 days. Not the average — by traffic source if you can, by district at minimum.
- Take each Meta campaign’s purchase value. Multiply by (1 − RTO%). That’s your delivered revenue.
- Divide by ad spend. That’s your ROAS after RTO per campaign.
- Compare to the table above. Act on it.
If you do this once a week, you’ll catch a leak inside two weeks instead of two months.
Analify AI — free Meta profit view
Stop guessing your profit.
Connect Shopify, Meta, TikTok and Bosta in 5 minutes.
Start freeWhat Analify AI does with this
We pull Meta spend, Meta purchase value, and Bosta delivery data on every refresh. We compute ROAS after RTO per campaign, per adset, per ad, per district, per product. We highlight campaigns where ROAS after RTO crosses below break-even. We show you what platform ROAS is, side by side with the real number — not to argue with Meta, but to give you the truth to act on.
Your media buyer doesn’t have to maintain a spreadsheet. Your agency doesn’t have to send a weekly PDF that’s three days old. The number is there when you open the app.
The whole game is: stop scaling lies, start scaling truth. Platform ROAS is the lie. ROAS after RTO is the truth. In Egypt, that gap is the difference between a real business and a beautiful ghost.