RTO — Return To Origin — is the single biggest hidden cost in Egyptian DTC. It eats more margin than ads, more margin than COGS, and most founders can’t tell you their RTO number by district to within five points.
This post is a district-by-district benchmark for Cairo and Giza based on the patterns we see across our pilot brands. It is not a survey. It is not a press release. It is what we observe in live data feeds from Bosta and other couriers across more than a dozen Egyptian DTC stores.
If you sell COD in Egypt, this is your map.
The headline number is a lie
Average RTO across Egyptian DTC is somewhere between 20% and 35%. That range is so wide it’s useless. The average masks a brutal truth: certain districts behave very differently from others, and when you mix them in one number, you can’t act on it.
You don’t have an RTO problem. You have a Maadi RTO problem. Or a 6th of October RTO problem. Or a governorates-outside-Cairo RTO problem. Find which one, then act.
The benchmark table
These are observed ranges from pilot brands across fashion, beauty, and home decor. Your numbers will sit somewhere inside the range depending on product, AOV, and confirmation flow.
| District | Healthy | Watch | Bleeding |
|---|---|---|---|
| New Cairo (5th Settlement) | <18% | 18–24% | >24% |
| Heliopolis | <18% | 18–24% | >24% |
| Nasr City | <22% | 22–28% | >28% |
| Maadi | <22% | 22–30% | >30% |
| Mohandessin / Zamalek | <18% | 18–23% | >23% |
| 6th of October | <25% | 25–32% | >32% |
| Sheikh Zayed | <22% | 22–28% | >28% |
| Giza (core) | <26% | 26–33% | >33% |
| Greater Giza (Haram, Faisal) | <30% | 30–38% | >38% |
| Cairo governorates (Helwan, Marg) | <30% | 30–40% | >40% |
A few things to notice immediately. New Cairo and Heliopolis are the cleanest. Maadi looks clean on paper, but the moment AOV goes above EGP 1,000 it spikes. 6th of October is a coin flip. Anywhere outside the Cairo ring road is rough — not because the customers are bad, but because the courier loop is longer, the buyer is harder to reach, and the cash is harder to confirm.
Analify AI — free returns and RTO view
Stop guessing your profit.
Connect Shopify, Meta, TikTok and Bosta in 5 minutes.
Start free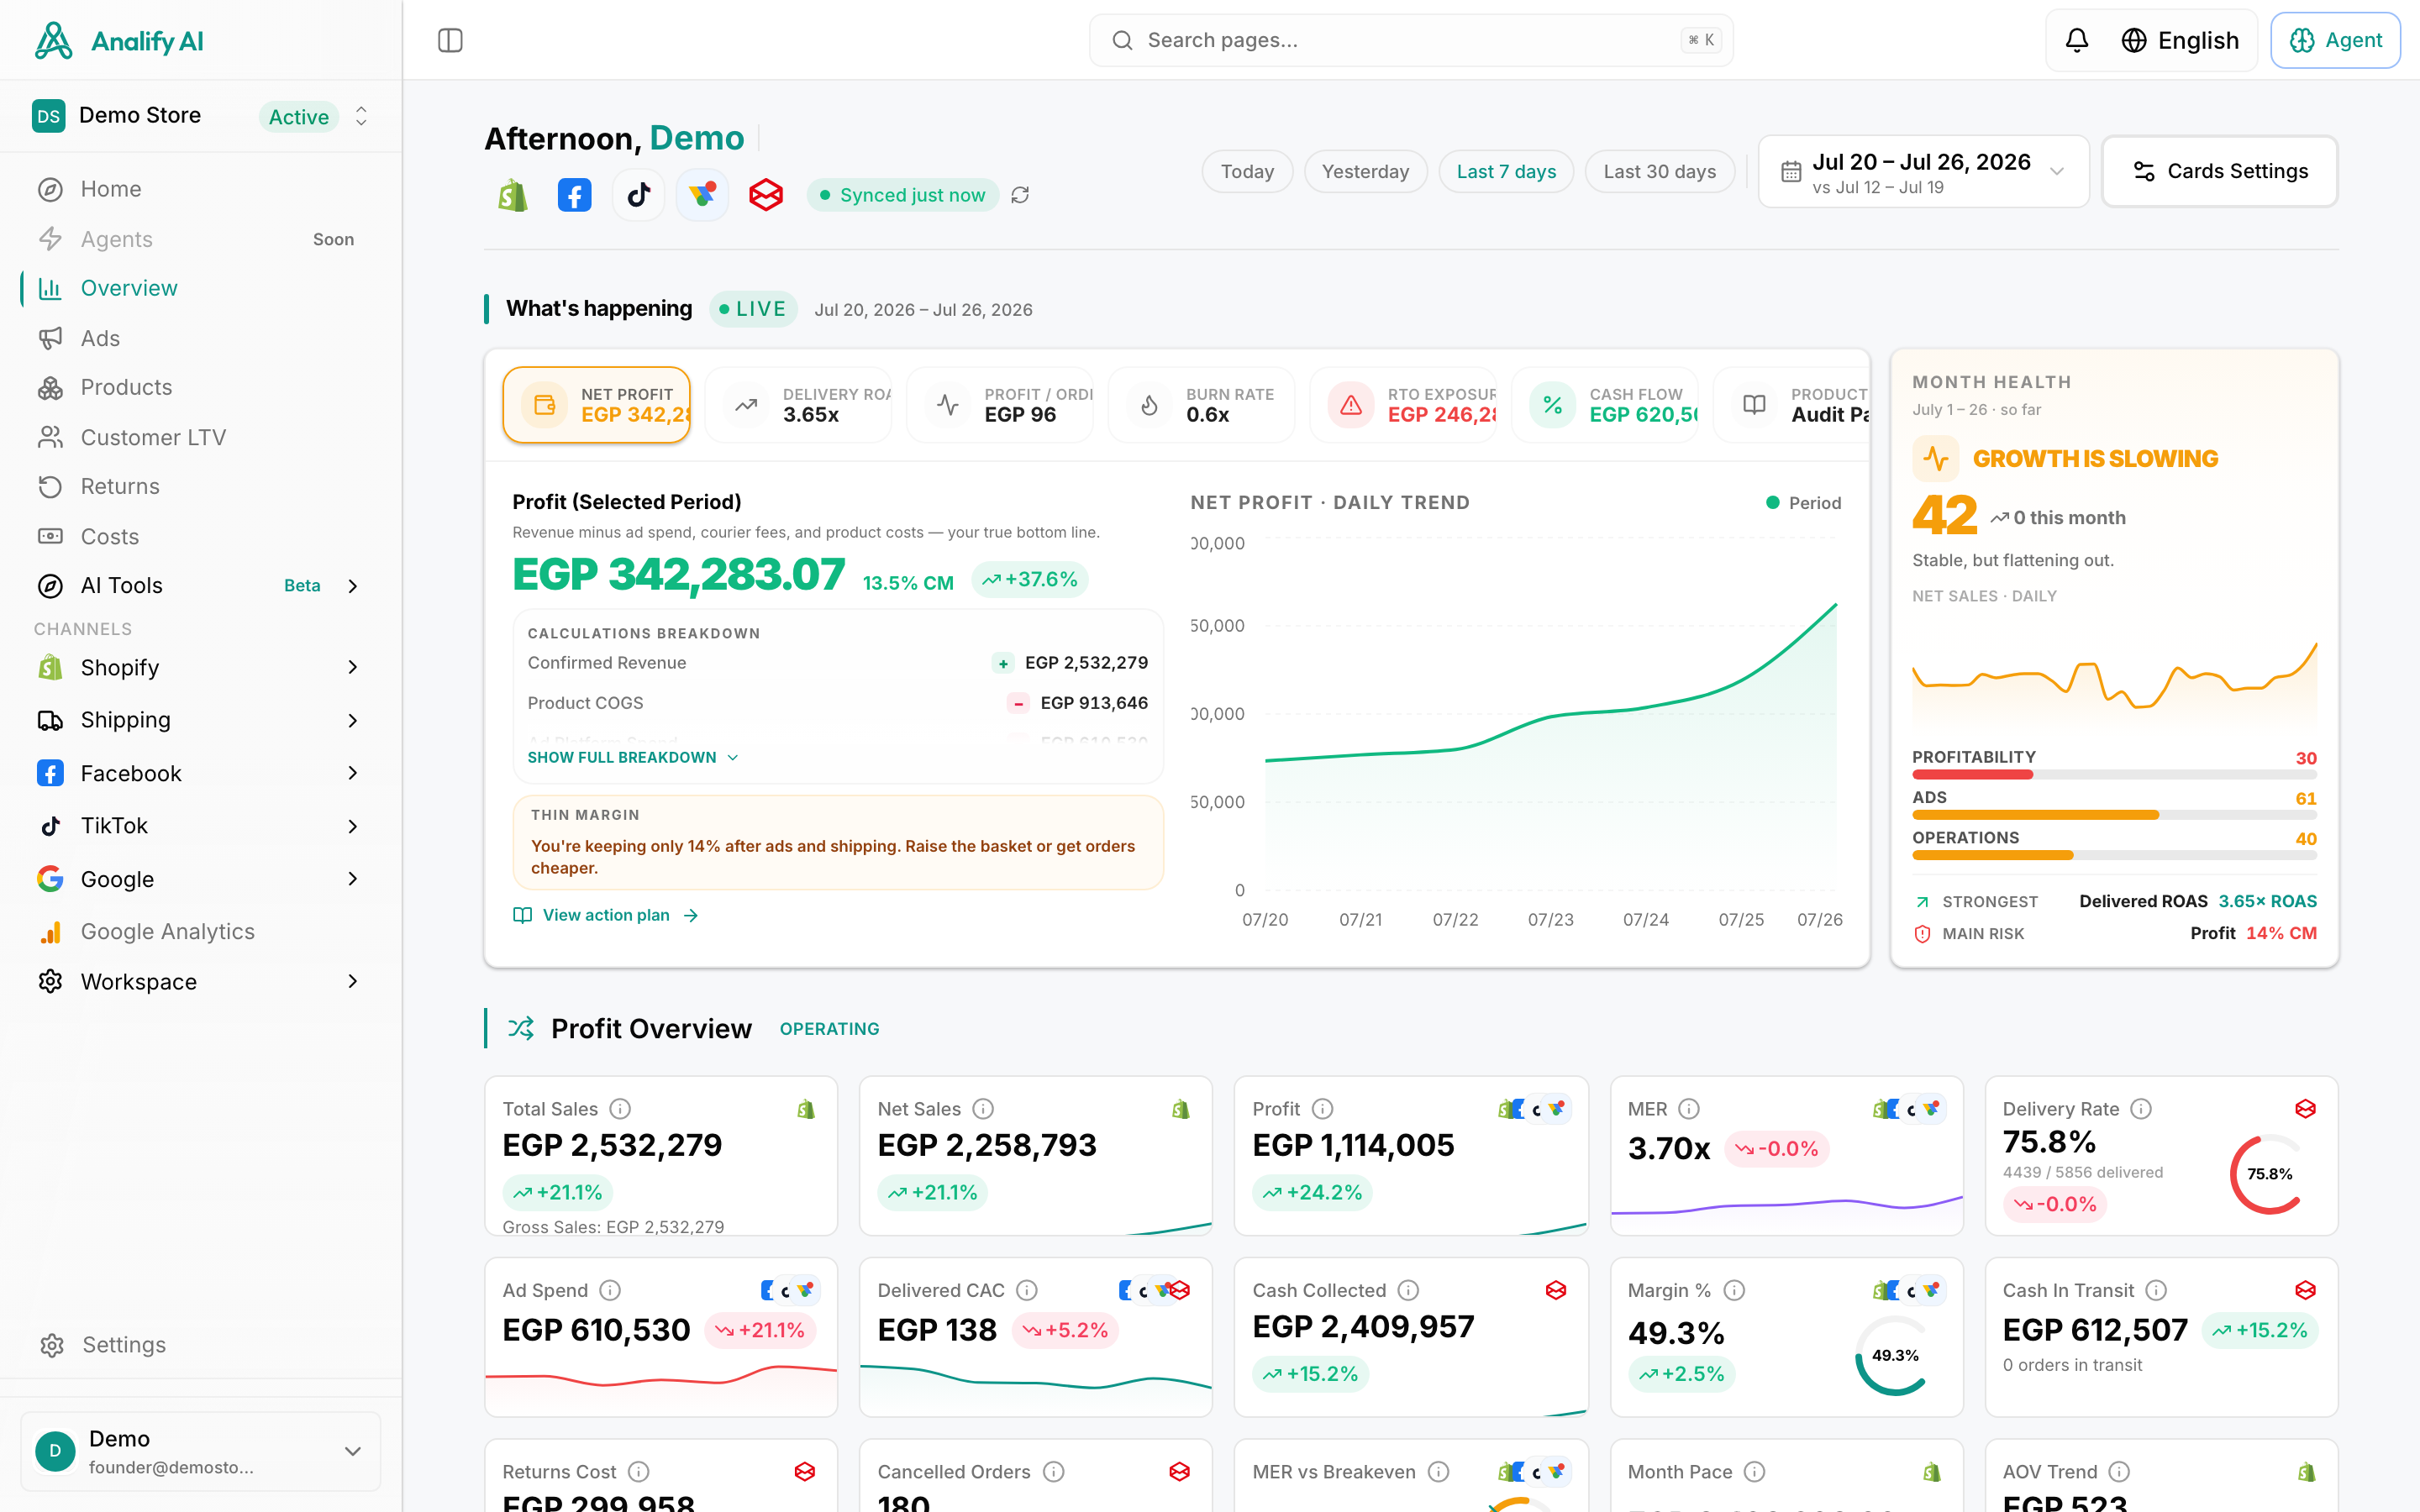
Why districts differ — the real reasons
Most founders blame "the customer." That’s lazy. RTO has structural drivers and you can act on every one of them.
Reason 1: Driver routing density
Bosta and other couriers route by zone density. New Cairo has dense delivery loops; the driver visits 40 stops in a day in a tight radius. Maadi is also dense but the buildings are old, the elevators don’t work, and the driver gives up after one failed attempt. 6th of October is a sprawl — the driver might cover 80 km in a day. Each km is another chance for a missed pickup.
Reason 2: Confirmation method
If you confirm orders by WhatsApp before shipping, RTO drops 5–10 points everywhere. If you ship without confirming, you ship to dead numbers and dead addresses. We see brands skip confirmation when they’re scaling, and watch RTO climb from 22% to 35% in two weeks.
Reason 3: AOV and the COD ceiling
Egyptian buyers will pay EGP 300–700 at the door without thinking. At EGP 1,200 they hesitate. At EGP 2,000 they need to actually have the cash in their wallet — and they often don’t. RTO climbs with AOV in a way most founders don’t graph. Above EGP 1,500 AOV, expect RTO to be 5–10 points higher than your store average.
Reason 4: Product fit
Beauty and personal care: lower RTO. The buyer ordered it because they ran out. Fashion: medium RTO — the buyer changes their mind, the size looks wrong on the model in the lift mirror. Electronics: higher RTO at high AOV because of buyer hesitation. Home decor: mixed, depends heavily on size and assembly.
Reason 5: Time to delivery
Anything more than 72 hours from order to delivery in Cairo, RTO climbs. The buyer ordered it on a Tuesday because they were excited. By Friday they’ve forgotten. Cut delivery time, cut RTO.
What to actually do
Move 1: See RTO by district
Stop looking at the average. Pull RTO by district at least weekly. If you can’t pull it from your courier dashboard easily, that’s the first leak. (Analify AI puts this on the homepage.)
Move 2: Set a floor by district
Anything in "bleeding" gets a hard rule. Pause COD for that district for two weeks. Switch to prepaid-only with a small Instapay discount (5–10%). You’ll lose volume. You’ll keep margin. The math almost always wins.
Move 3: Pre-confirm by WhatsApp on high-AOV orders
If the order is above EGP 1,200, send a WhatsApp confirmation before handing it to the courier. Use a template. Don’t wait for a reply more than 12 hours. No reply, no shipment. This single rule, alone, cuts high-AOV RTO by a third.
Move 4: Watch the 6th of October trap
6th of October orders often come from buyers who saw the ad on Instagram and clicked impulse. They’re the highest-intent click-to-conversion segment AND the highest-RTO delivery segment. The combination tricks you into scaling spend. Watch ROAS-after-RTO by district before you scale.
Move 5: Talk to the courier about your worst zone
This is the move most founders skip. Call Bosta. Ask for the success rate on your specific zone. Ask if they can route a more experienced driver. Sometimes a thirty-minute call drops your worst district by five points.
What we recommend per stage
If you’re doing fewer than EGP 200K a month: pre-confirm every order over EGP 800. Pause COD for any district above 35%. Don’t chase volume.
If you’re doing EGP 200K–1M a month: pull RTO by district weekly. Set a hard floor per district. Reward your courier service rep with a quarterly call.
If you’re doing more than EGP 1M a month: split couriers by district. Bosta is excellent for Cairo. Other couriers may serve Alexandria or the Delta better. Don’t marry one courier.
Analify AI — free returns and RTO view
Stop guessing your profit.
Connect Shopify, Meta, TikTok and Bosta in 5 minutes.
Start freeWhat Analify AI shows you
We put RTO on the homepage — by district, by product, by traffic source. It updates live every time you open the app. We highlight districts crossing the floor. We show you the EGP impact of every percentage point of RTO. We don’t tell you to "scale by X%." We tell you: "Maadi crossed 30%. That’s EGP 4,200 in courier fees this week with no revenue. Pause COD or call Bosta."
That’s the move. Find the bleed. Stop the bleed. Then scale what’s left.
A small disclaimer
These ranges shift over time. The 2023 numbers were different. The 2027 numbers will be different. What doesn’t shift is the pattern: there are good zones, watch zones, and bleeding zones. Your job is to know which is which — every week, not every quarter.
If your courier dashboard doesn’t give you RTO by district in under thirty seconds, that’s the leak before the leak.