Stop wasting hours on manual reports. Discover a fast way to generate advertising reports using automated tools, saving your agency thousands each month.
The fastest way to generate client-ready advertising reports is by using an automated reporting tool with multi-channel data connectors and pre-built templates. These platforms can slash your reporting time from over 6 hours per client per month to just a few minutes.
For agencies like yours, this translates into saving up to 80% of your reporting costs, which can easily add up to thousands a year.
If you've ever felt that soul-crushing dread on the first of the month, you know exactly what we're talking about. It's that feeling of knowing you're about to lose an entire day (or more) to the copy-paste Olympics.
You're jumping between Facebook Ads Manager, Google Ads, GA4, and Shopify, wrestling with spreadsheets, and just praying the numbers line up. This isn't just tedious; it's a massive opportunity cost. Your best strategists are stuck being data mules instead of finding the next big win for your clients. It's time we break the cycle of building manual marketing reports and get our time back.
What You’ll Learn
- The hidden cost of manual client reporting on your agency’s profitability
- How to calculate the hours your team wastes every month on spreadsheets
- Which automated reporting tools save agencies time
- How to pick the right platform based on your agency’s needs
- A 30-day roadmap to automate reporting and scale more efficiently
The Real Cost of Manual Client Reporting
Let's be brutally honest for a second. That "quick" monthly report you pull together is costing your agency a fortune. It's a silent killer of profitability and scalability, hiding in plain sight on your timesheets.
How Much Time Are You Really Wasting?
If you feel like you live in a spreadsheet, you're not alone. We've all been there. According to recent studies, most marketers spend over 6 hours weekly on reporting tasks. For agencies, the numbers are even more specific.
Research shows that agencies typically spend around four or five hours per client each month just compiling data.
Think about that. If you have 10 clients, that's 40-50 hours a month—an entire work week—spent on a task that a machine could do in minutes. It’s the digital equivalent of digging a ditch with a spoon when there’s a perfectly good excavator sitting right there.
Calculate Your Agency's Reporting Waste
Want to see the real damage? Let's do some quick back-of-the-napkin math together.
(Number of Clients) x (Hours per Report) x (Blended Hourly Rate) = Monthly Cost
Now, let's plug in some real-world numbers. Imagine a mid-sized agency with 15 clients. They spend a conservative 3 hours per report, and their team's blended hourly rate (including overhead) is $60.
(15 Clients) x (3 Hours) x ($60/hour) = $2,700 per month.
That's $32,400 per year. Some analyses show this figure can balloon to over $135,000 annually just copying and pasting numbers for larger teams. That's a senior media buyer's salary... spent on data entry. Ouch.
Analify AI — free media buyer view
Stop guessing your profit.
Connect Shopify, Meta, TikTok and Bosta in 5 minutes.
Start free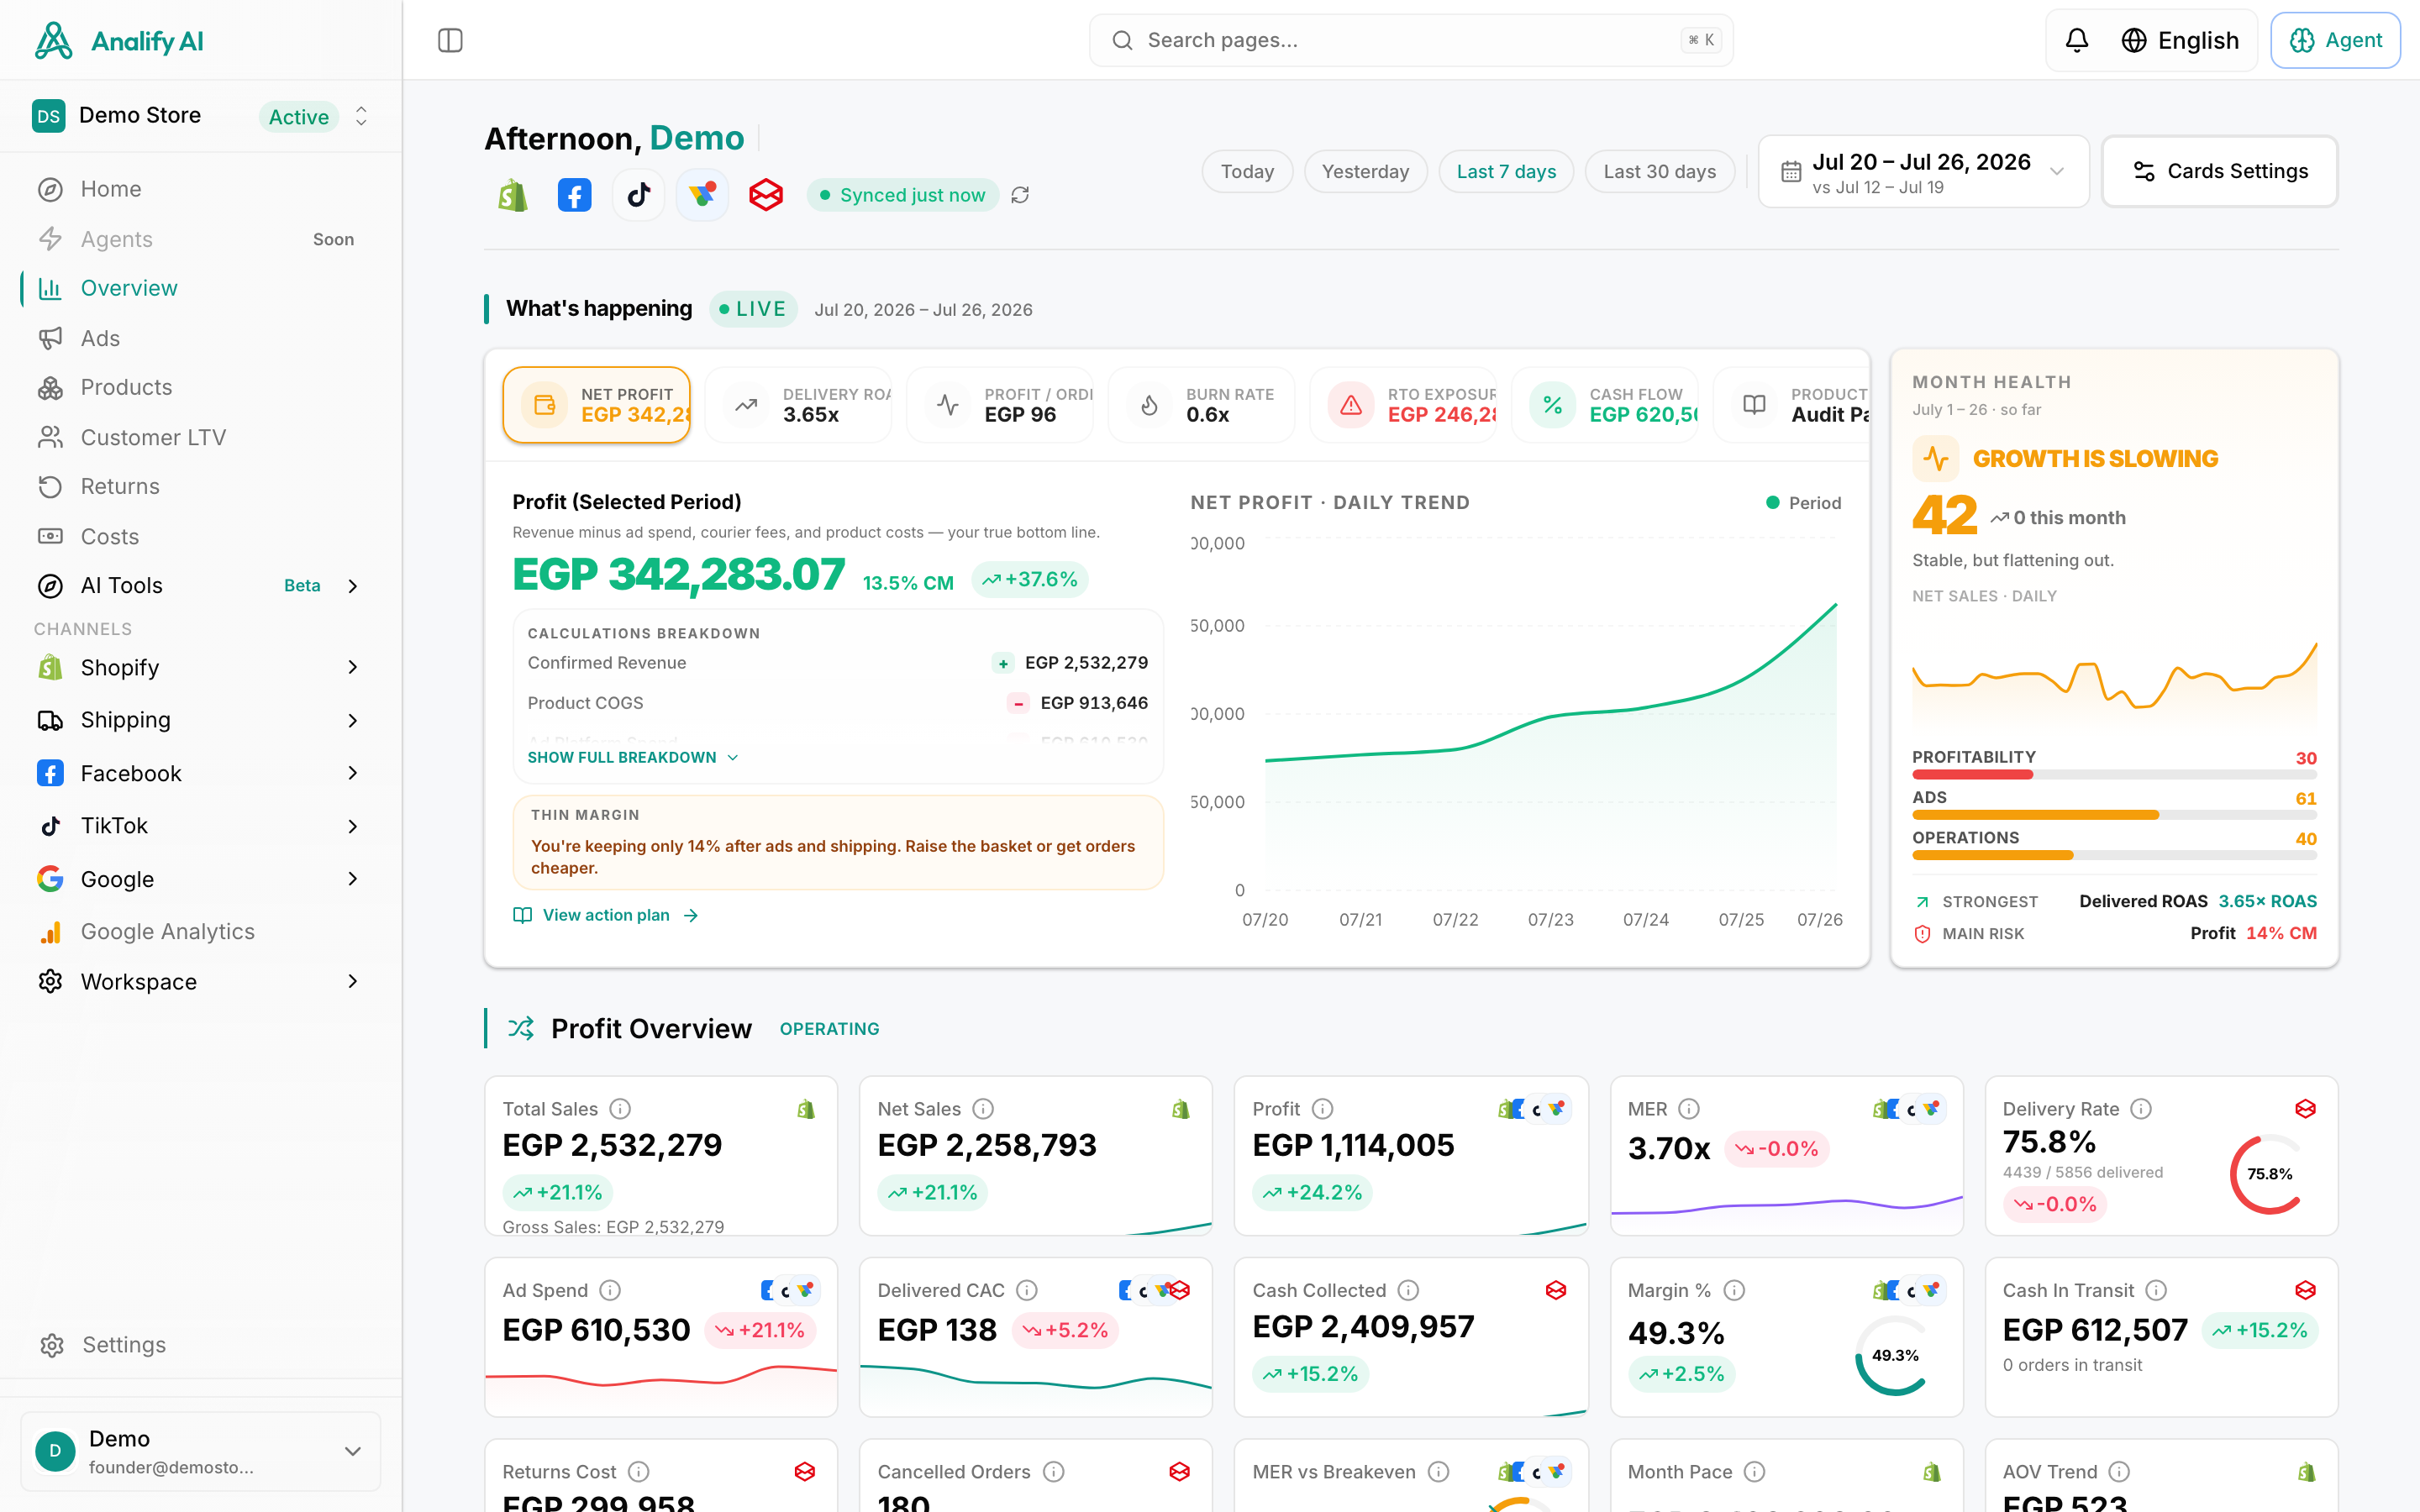
What is an Automated Reporting Tool?
Okay, so we've established that manual reporting is a money pit. The solution? Automation. But what does that actually mean in plain English?
Automated reporting is the process of using software to automatically collect data from various marketing channels and compile it into a visual report or dashboard, significantly reducing manual work.
Think of it as your tireless assistant who loves doing the boring stuff you hate. These tools are built on a few core components that make the magic happen:
- Data Connectors: This is the secret sauce. A data connector is a pre-built integration that allows a reporting tool to pull data directly from a marketing platform's API (like Meta Ads, Google Ads, or Shopify). It's what lets the platforms "talk" to each other so you can finally stop exporting CSVs. The data just flows in automatically.
- Dashboards & Templates: Instead of staring at a blank spreadsheet, you get beautiful, pre-built dashboards. You connect your sources, and the data instantly populates into professional-looking charts and graphs. This is a game-changer when you need to learn how to build client dashboards that actually impress.
- Sharing & Distribution: Once your report is ready, most tools let you share it via a live link for real-time viewing or download it as a PDF for those static monthly summaries. Some platforms even offer automated email scheduling.
- White-Labeling: This is a key feature for agencies. White-label reporting allows an agency to brand a third-party software's reports with its own logo and color scheme, presenting them to clients as if they were created in-house. It makes you look polished and professional, reinforcing your brand with every report.
Top 7 Automated Client Reporting Tools for 2024
The market is flooded with reporting tools, and they all claim to be the best. So, how do you choose? We evaluated these tools based on their integration depth (especially for performance channels), ease of use for busy agencies, scalability, and overall return on investment.
1. Analify (Best All-in-One for E-commerce Agencies)
Alright, we’re a bit biased, but hear us out. Analify isn't just a reporting tool; it's a complete performance advertising platform built for advertisers who need to do more than just report on numbers—they need to improve them.
Best for: E-commerce and lead-gen agencies that want to connect reporting directly to action and optimization.