
“What did we actually make yesterday?”
Profit after every cost, to the dollar
Dashboards
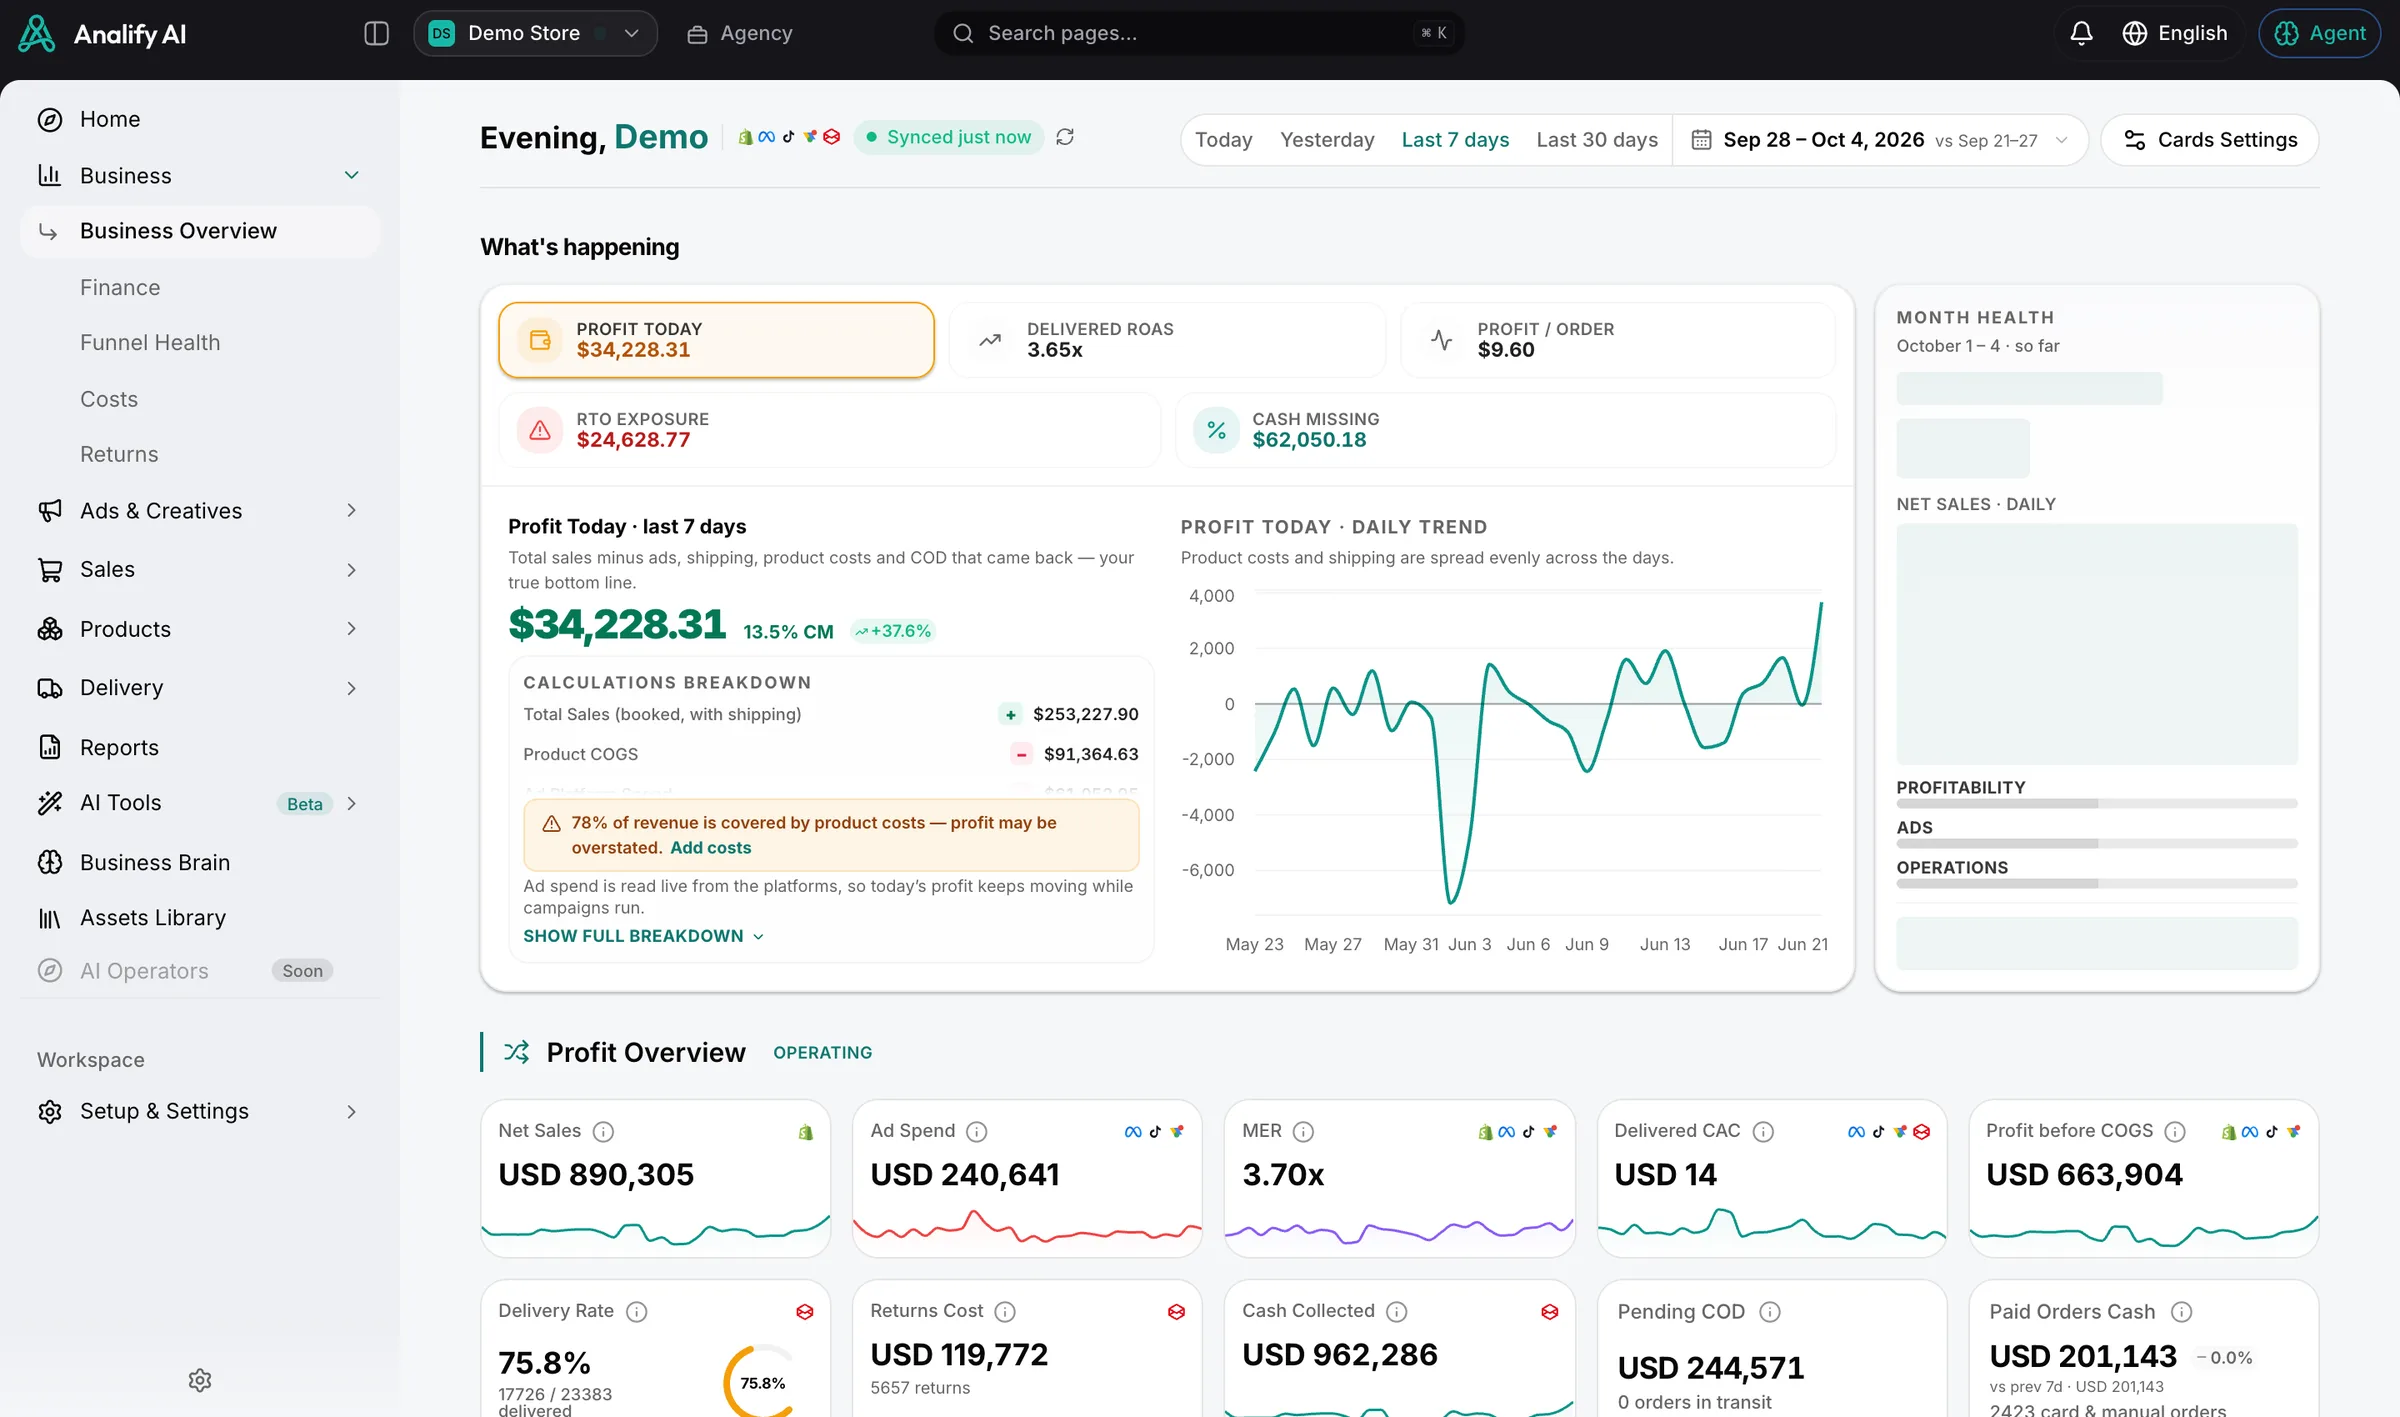
Profit after ads, shipping, product costs and returns — for every campaign, product and day. Click any number to see its math.
Illustrative data — sample store and numbers.
Works with the tools you already use

Profit, costs, sales, products and customers. Every screen here is the real product, and every number opens its math.
In one sentence
Analify Dashboards show your whole ecommerce business in one place — profit, ads, products, customers, shipping, returns and cash — with your real costs included. Every number breaks down into the calculation behind it, and the same numbers power the Analify Agent and your reports.
Connected
Yesterday, to the dollar
Why is margin below target?
Two Meta campaigns lose $1,240 a week once returns land.
Illustrative data — sample store and numbers.
Without Analify
With Analify
Copy numbers from five dashboards into a sheet every morning
Profit after every cost, ready when you open it.
Trust platform ROAS that ignores returns and product cost
Real profit per campaign, after returns.
Notice a profit drop a week too late
What needs attention is flagged as soon as your data syncs.
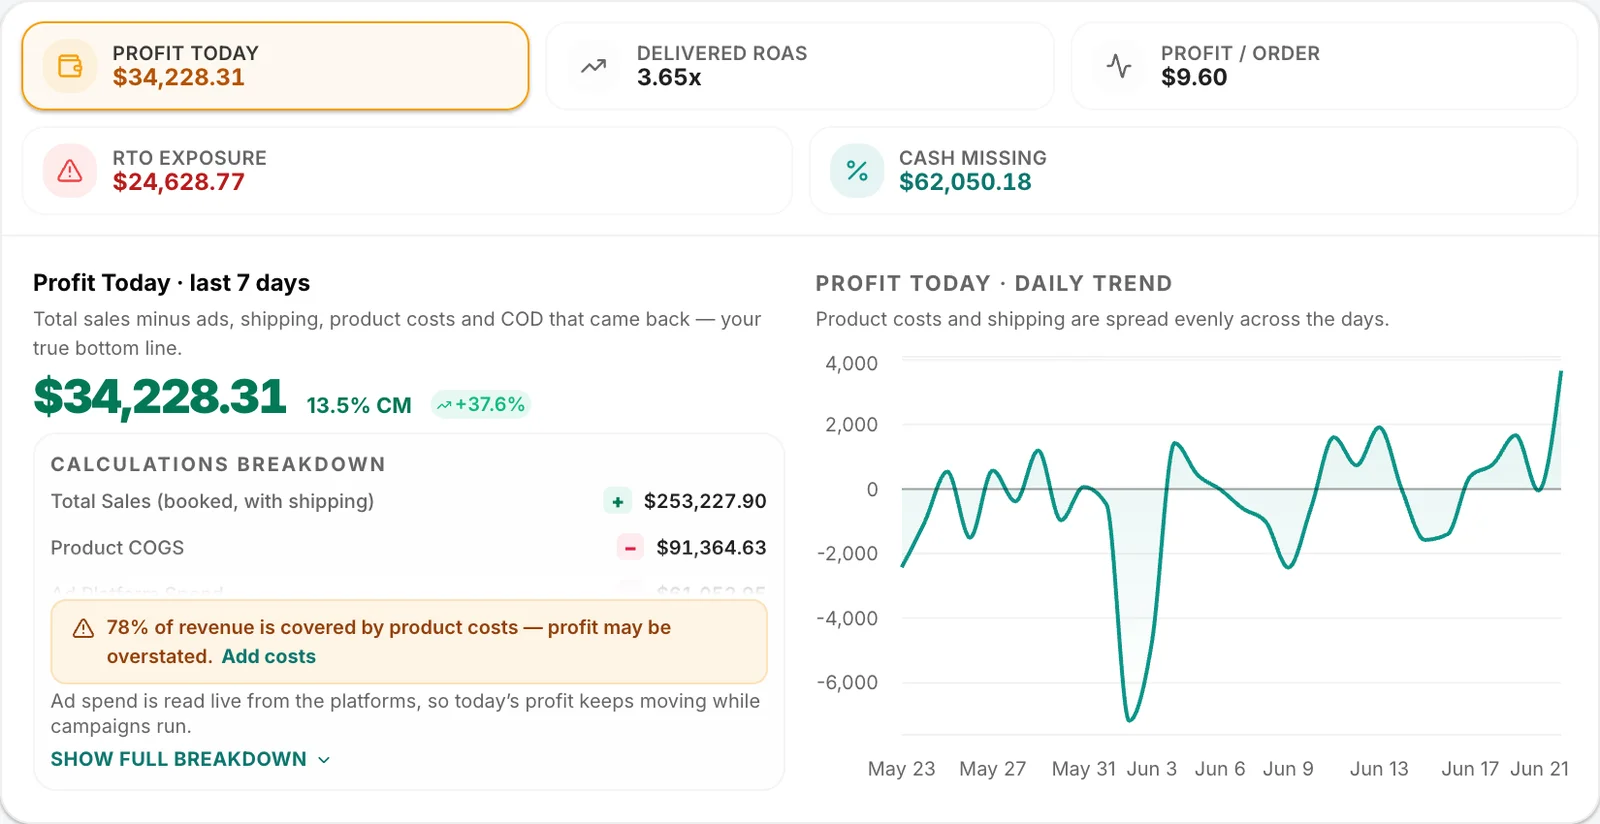
The profit line shows the dip. Beside it, what needs attention tells you the cause in plain words.
Illustrative data — sample store and numbers.
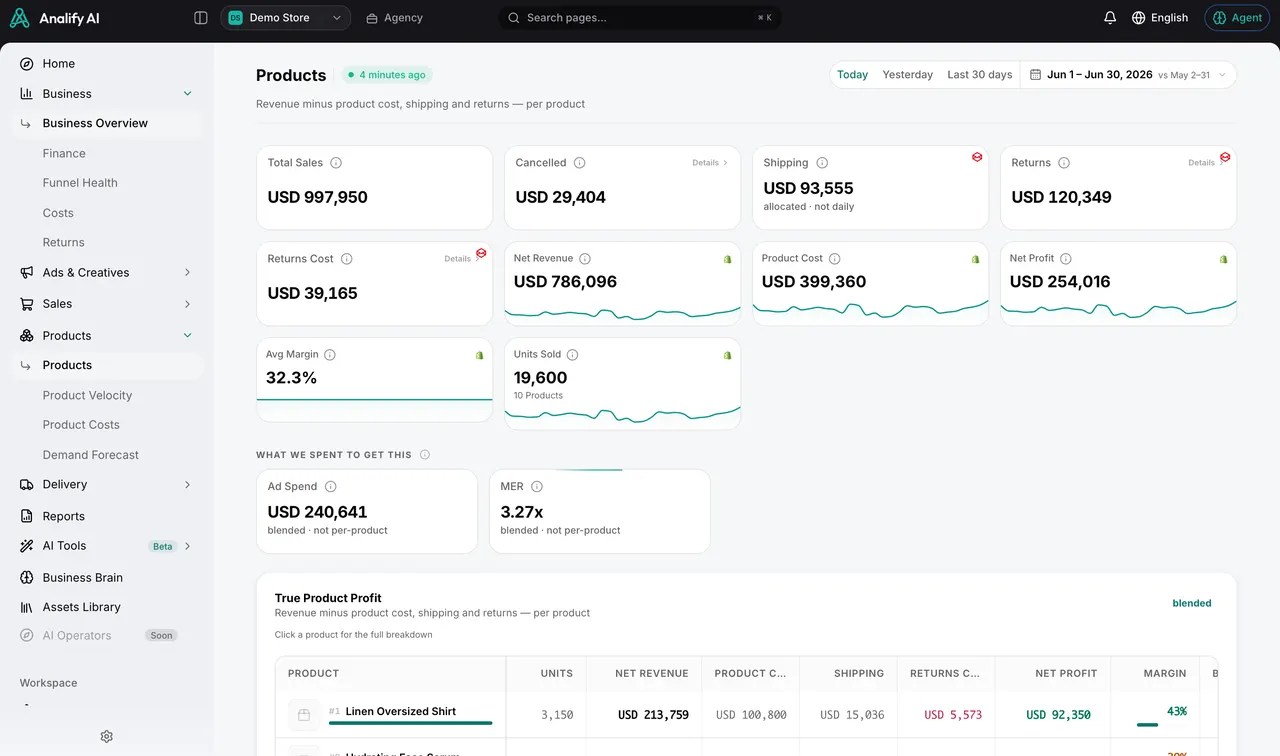
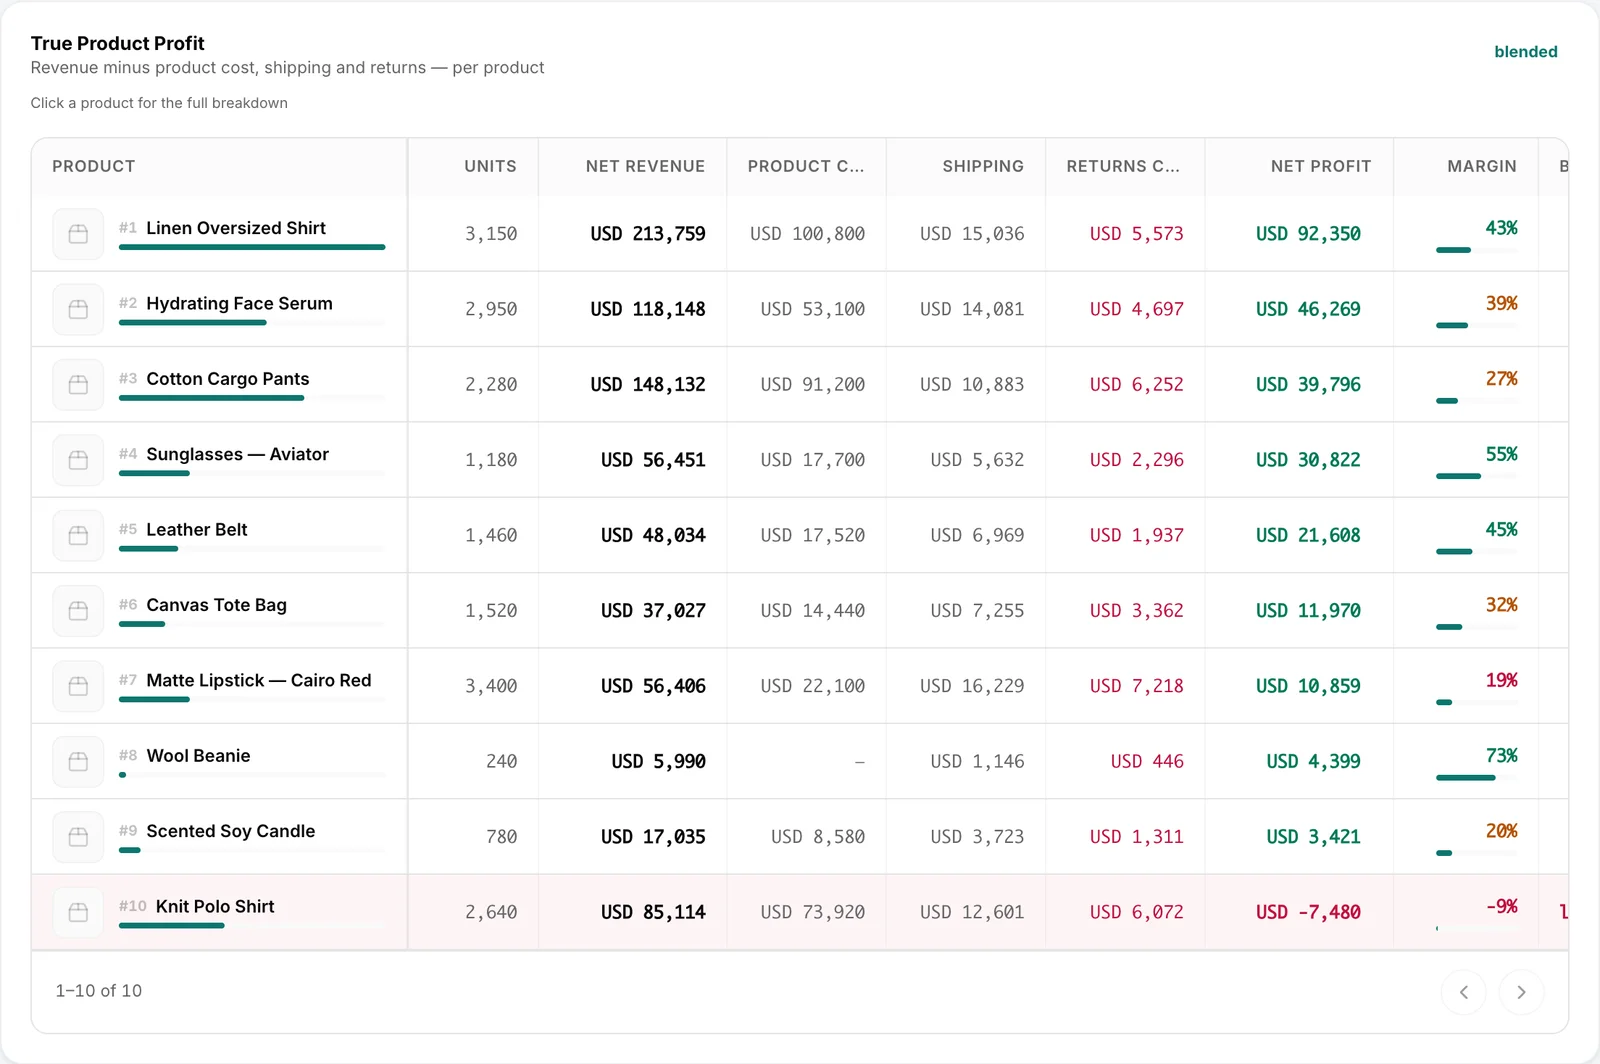
Sales next to net profit after product cost, shipping and returns. A product can sell well and still lose money.
Illustrative data — sample store and numbers.
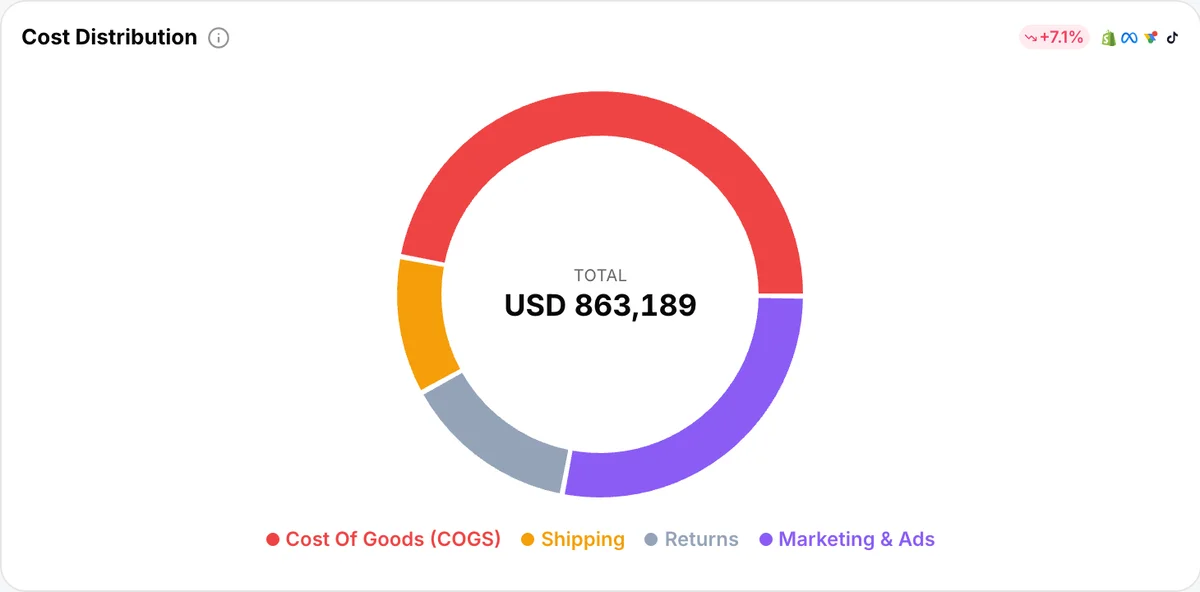
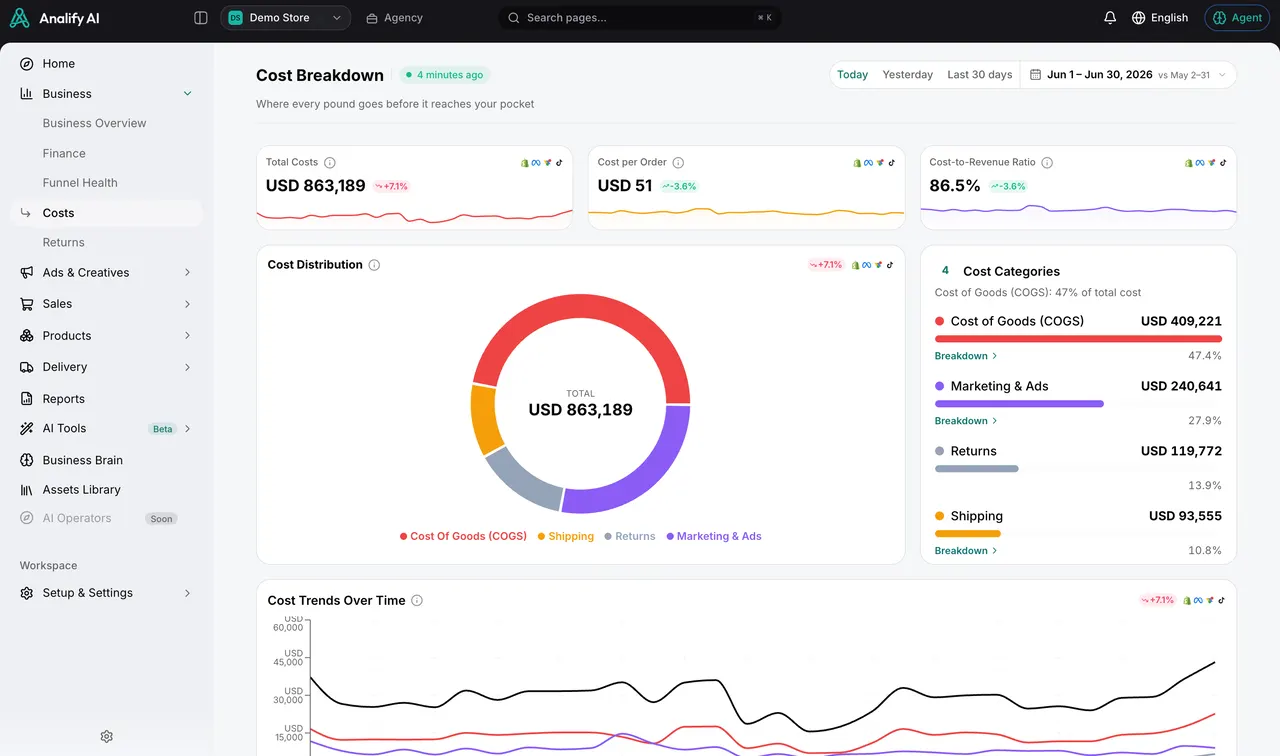
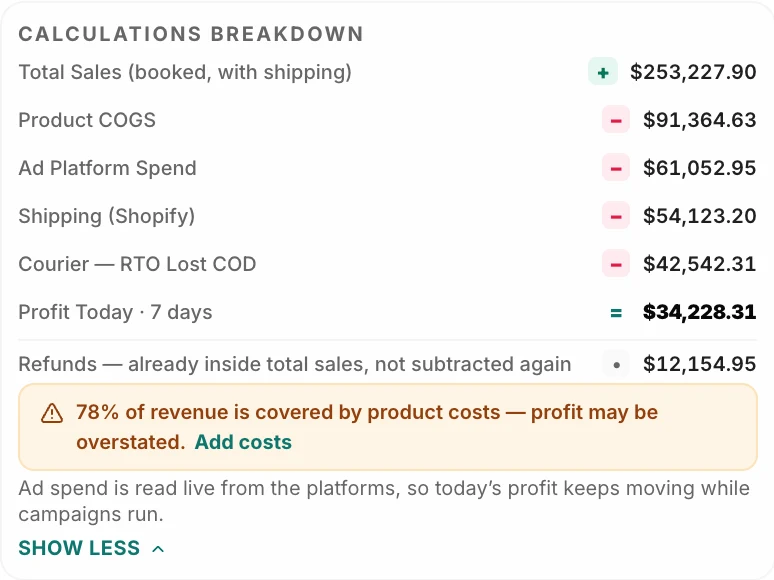
Every figure breaks down into revenue, ad spend, shipping, product cost and returns — so you can trust it, and so can the Agent.
Illustrative data — sample store and numbers.
Four views most teams open every day — each one built on the same costs and the same math.
Real profit by product · this week
Profit
Revenue after product costs, ads, shipping, returns and other costs you add.
Products
Compare sales, costs and profit product by product.
Calculation transparency
Follow the math behind every reported number.
Campaigns · after returns
Advertising
Compare channels, campaigns, spend and results in one place.
Meta, TikTok and Google
Each platform in detail, with Google where the connection is available.
Creative performance
Find your strongest ads and spot signs they're wearing out.
Shipping · this week
Shipping
Review delivery performance across your couriers.
Returns
Explore return and RTO patterns by product and region.
Cash collection
See courier cash and COD collection in the same view as sales.
Conversion funnel · this week
Customers and cohorts
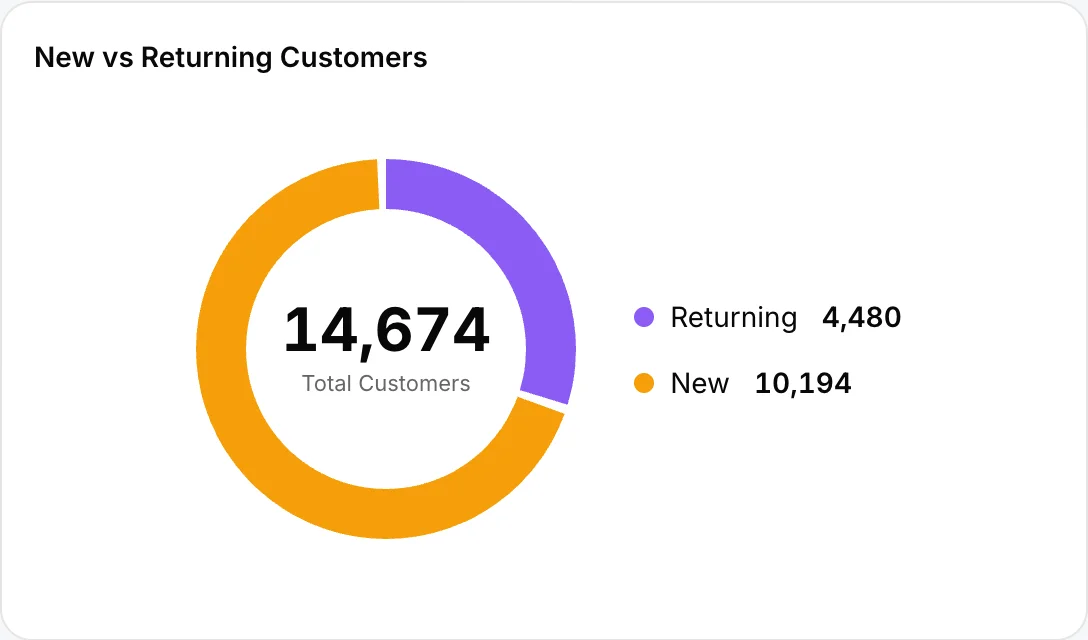
Explore buying patterns and compare customer groups over time.
Conversion funnel
See where visitors leave before they buy.
Sessions
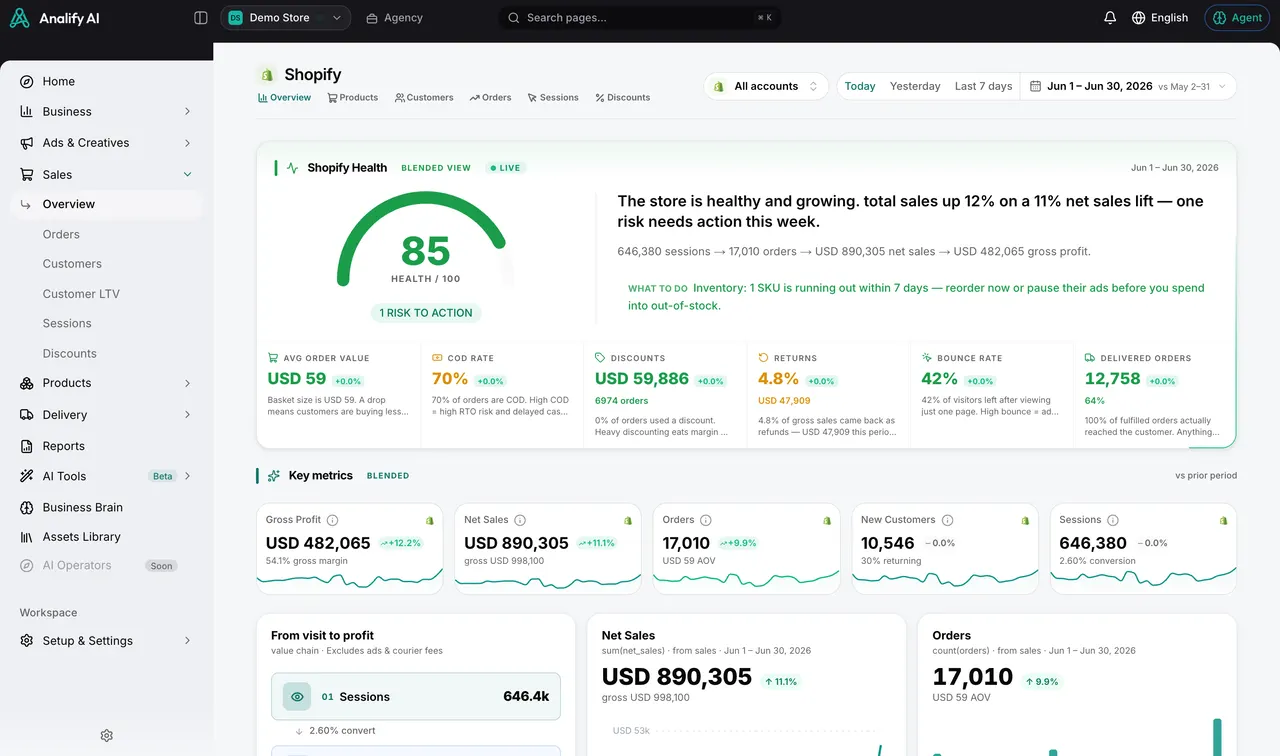
Review store traffic and visitor behaviour.
Illustrative data — sample store and numbers.
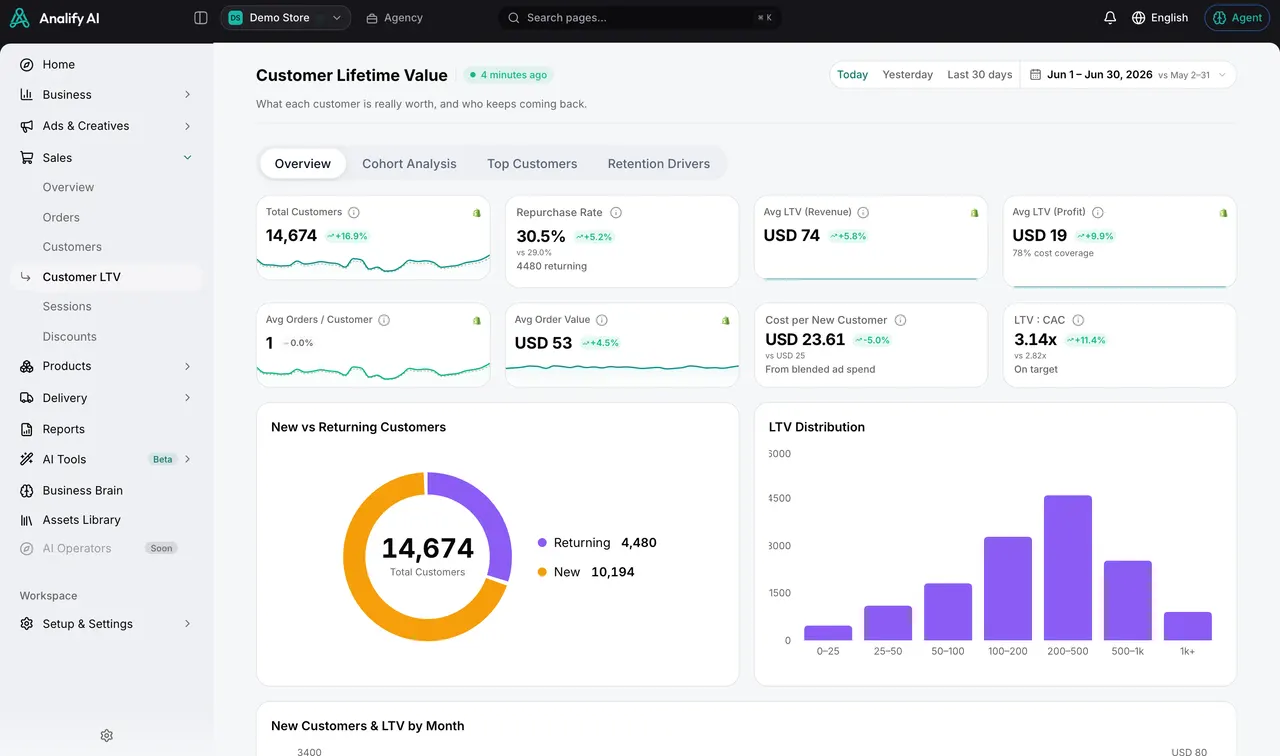
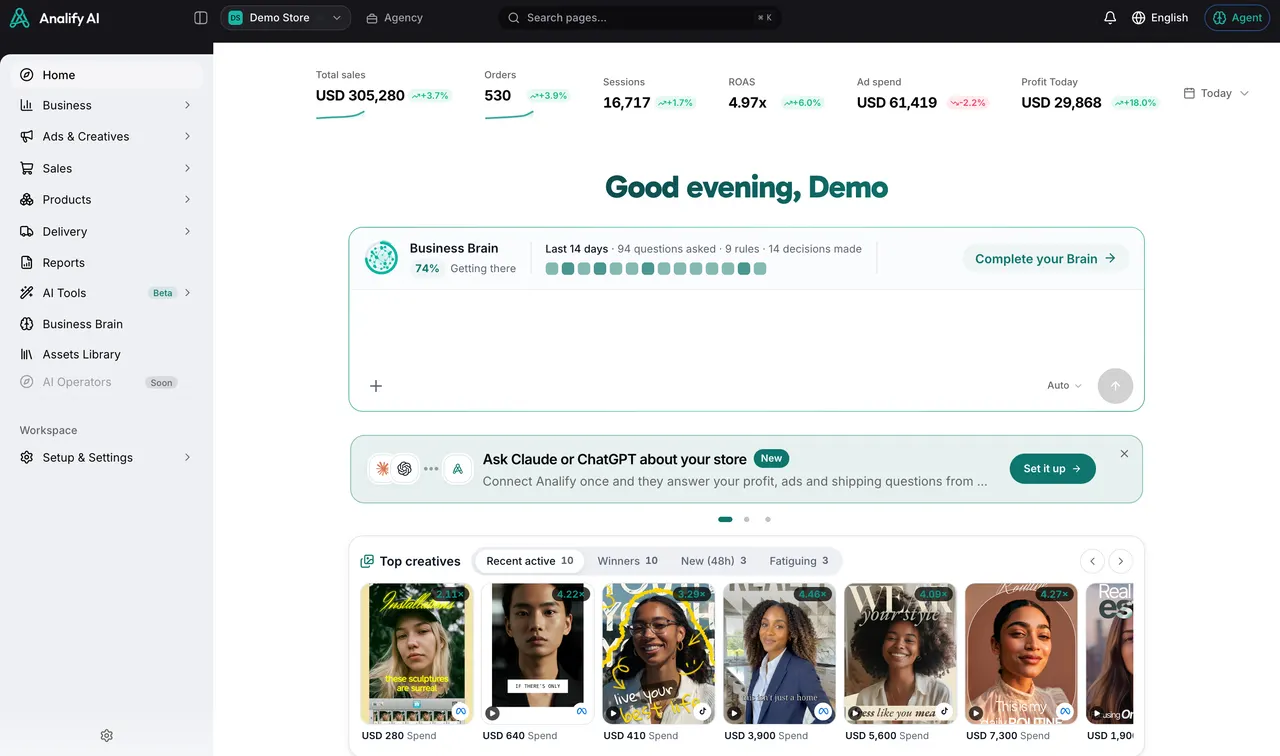
Over twenty views of your business, each with the math behind it.
Overview
Profit
Advertising
Store
Customers
Shipping & cash
Google dashboards appear where the connection is available. Profit is only as complete as the costs you add.
“What did we actually make yesterday?”
Profit after every cost, to the dollar
“Which campaigns lose money after returns?”
Real profit per campaign, beside ROAS
“Which products should we stop pushing?”
Product profit after costs and returns
“Where do visitors drop off?”
The conversion funnel, step by step
“How much cash is still with the courier?”
Courier cash and collection status
“Is this week better than last?”
A period comparison on any metric
Ask your AI about it
Every number shows its math
Open any metric to see how it was calculated, from which data. Accuracy depends on the costs and sources you connect.
Permissions decide who sees what
Finance and profit views follow each person's role and permissions.
Your real costs, from the Brain
Product costs and rules come from your Business Brain, not guesses.
One set of numbers everywhere
Dashboards, the Agent, reports and connected AI all use the same math.
A business overview plus profit, advertising (Meta, TikTok and Google where connected), Shopify, orders, products, customers, sessions, conversion funnel, creative performance, shipping, returns, COD and cash collection, customer cohorts, store health, decision signals and period comparisons.
Profit is revenue after product costs, advertising, shipping, returns and other available costs. Product costs come from your Business Brain, and every reported number lets you follow the calculation behind it.
Ad platforms report revenue they attribute to ads. They don't subtract product costs, shipping or returns. Analify shows platform-reported results next to real profit, so a campaign with a high ROAS can still show a loss after returns.
No. Dashboards are the evidence; the Agent is where you ask why something moved and approve what happens next. Both use the same numbers, so what you see in a dashboard matches what the Agent explains.
Shopify for store data, Meta and TikTok for ads, Google where the connection is available, and your courier for shipping, returns and cash. Product costs and rules come from your Business Brain.
Yes. Team roles and permissions control access to areas like ads, products, shipping, COD, finance and profit, so each person sees what their role allows.
Connect your company, build its memory and start asking, deciding and approving from one place.
See pricing